About KAESER KAESER Compressors is one of the world’s leading manufacturers and providers of compressed air products and services. They manufacture compressed ...
 Kyla Ball
3 min read
Kyla Ball
3 min read
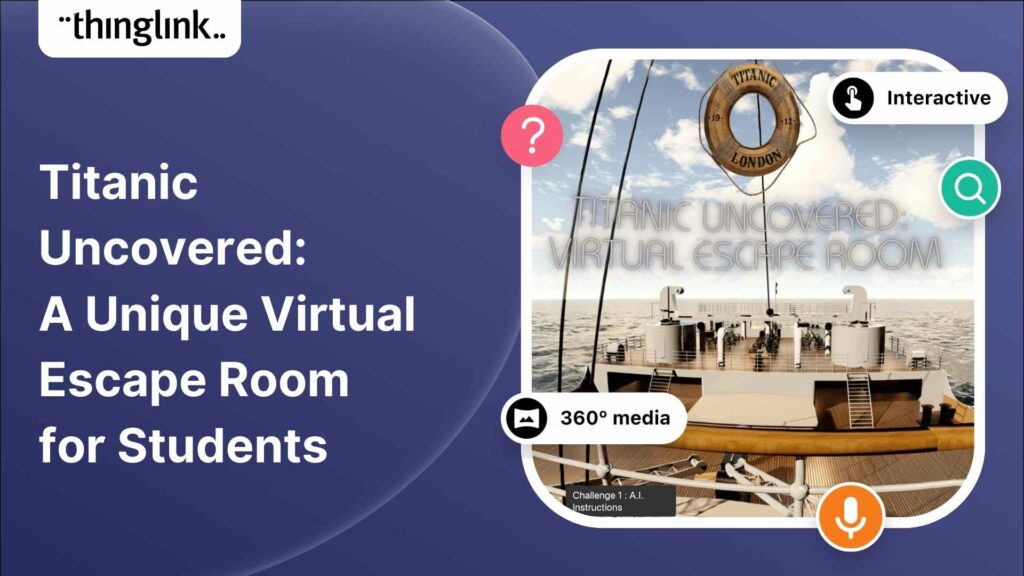
Educator Dwitney Bethel has created an incredible digital escape room using ThingLink’s Scenario Builder, set during the tragic maiden voyage of the Titanic...
Kyla Ball
8 min read
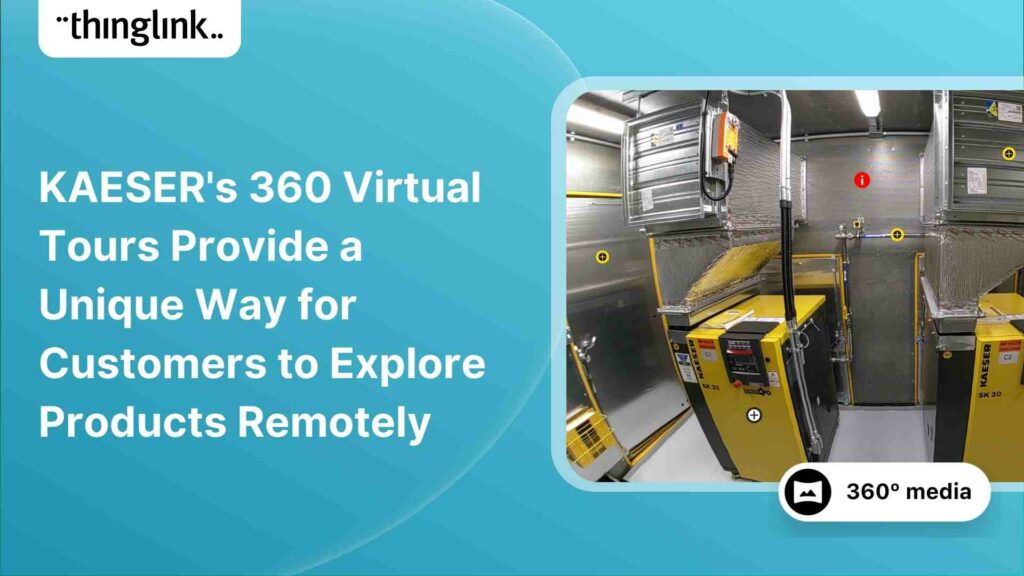
In this case study we look at how a global leader in weather and environmental measurements has opened up its incredible new R&D center and some of its other...
Kyla Ball
6 min read
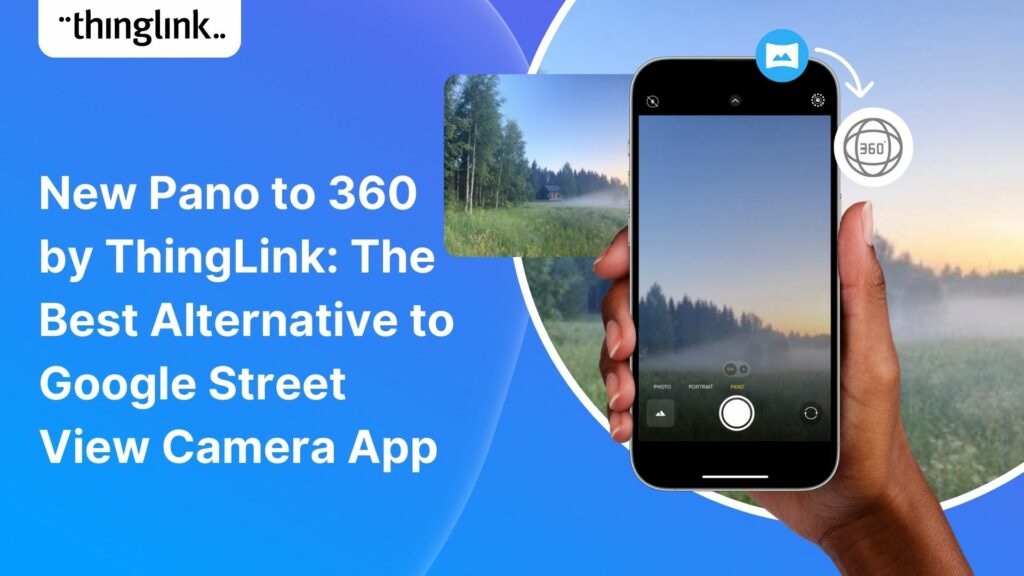
Dive into a universe of detail with Pano to 360: no more multiple shots, just easy, fully immersive 360 photospheres! Since Google decided to retire the beloved...
Virtual tours are now one of the cornerstones of real estate marketing, giving potential buyers the opportunity to view a property at a convenient time and place...
Kyla Ball
3 min read
ThingLink Launches a Revolutionary Solution for Capturing 360 Images In light of the discontinuation of the Google Street View Camera app, ThingLink has answered...
Kyla Ball
2 min read
QR codes are having a renaissance – and it’s well deserved! These versatile squares offer endless opportunities for creativity and engagement. In this...
Kyla Ball
6 min read
An effective marketing communications strategy is crucial for the success of any company, of any size. But for a small business or start up with no marketing team...
Kyla Ball
4 min read
Virtual tours have become an integral part of the real estate industry, allowing potential buyers to explore properties from the comfort of their homes – ...
Kyla Ball
5 min read
In this blog we look at what digital storytelling is, how it is being used, and provide three great examples of how ThingLink has been used for storytelling projects...
Kyla Ball
4 min read
In this blog we look at how you can use interactive videos – either as a training or educational tool for your learners, or for marketing or ecommerce purposes....
Kyla Ball
4 min read
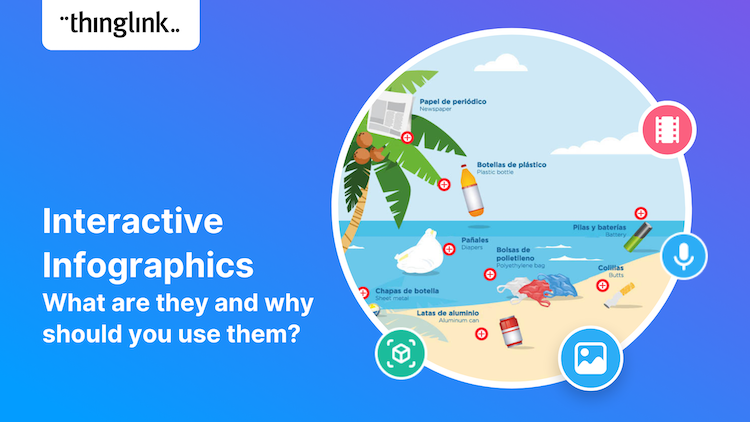
Infographics are a great way to present complex information in a clear and concise way. They are used for data visualization across every sector and can package...
Kyla Ball
4 min read
In this blog we have put together a little toolbox of 7 creative thinking skills to help you boost creativity in your everyday life and work. It’s a common misconception...
Kyla Ball
4 min read
In this short blog we look at how storytelling has developed from its earliest forms to the ultra-short form content that we interact with, multiple times per day,...
Kyla Ball
5 min read
In recent months, GPT3 has moved out of the tech news sections and into the headlines. But what is it exactly? How does it work and why has it become such a hot...
Kyla Ball
5 min read
Why is content marketing important? Content marketing is a powerful tool for businesses to reach and engage their target audience. It’s the cornerstone of...
Kyla Ball
4 min read
What is content marketing? Content marketing is a strategic approach to creating and distributing valuable content that is designed to build relationships with ...
Kyla Ball
3 min read
What is content marketing? Content marketing is a powerful strategy that businesses of all sizes can use to build an engaged audience and generate more leads. It...
Kyla Ball
4 min read
Content marketing has become an integral part of any successful business strategy, regardless of business type or size. It helps to create relationships, build ...
Kyla Ball
4 min read
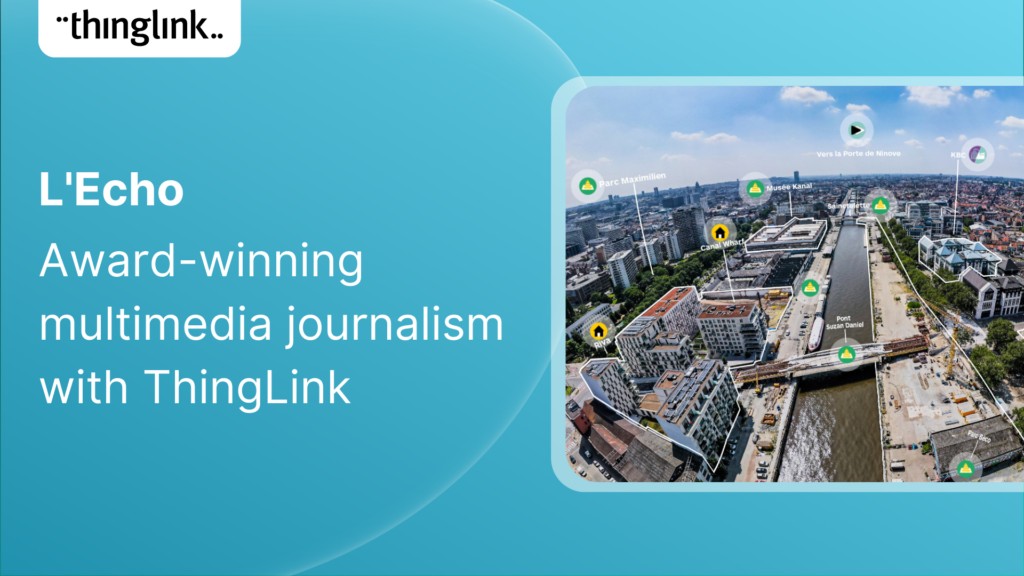
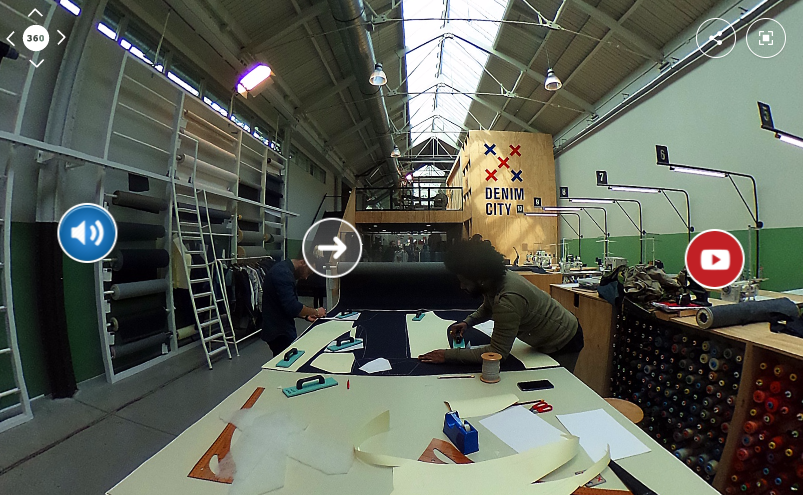
Multimedia reporting is being used ever more frequently by all media platforms. In this blog we showcase a great example of multimedia journalism from Belgium which...
Kyla Ball
5 min read
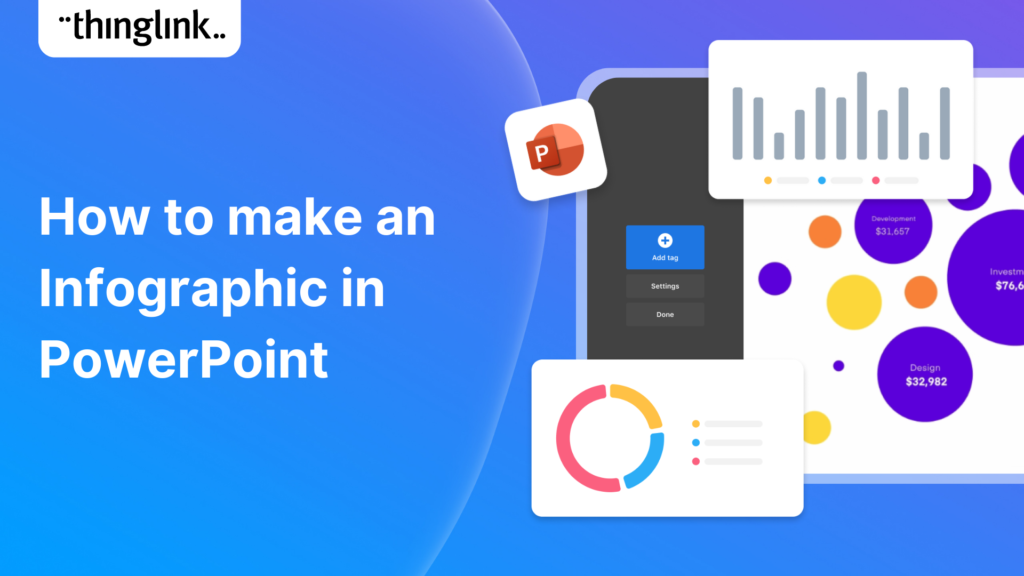
In this blog post, we’ll show you how to make an infographic in Microsoft PowerPoint. Working with shapes, images, icons, and text you can easily create a...
If you create or provide eLearning courses or workplace training, or you create any type of content marketing, you need to know how to use infographics. Infographics...
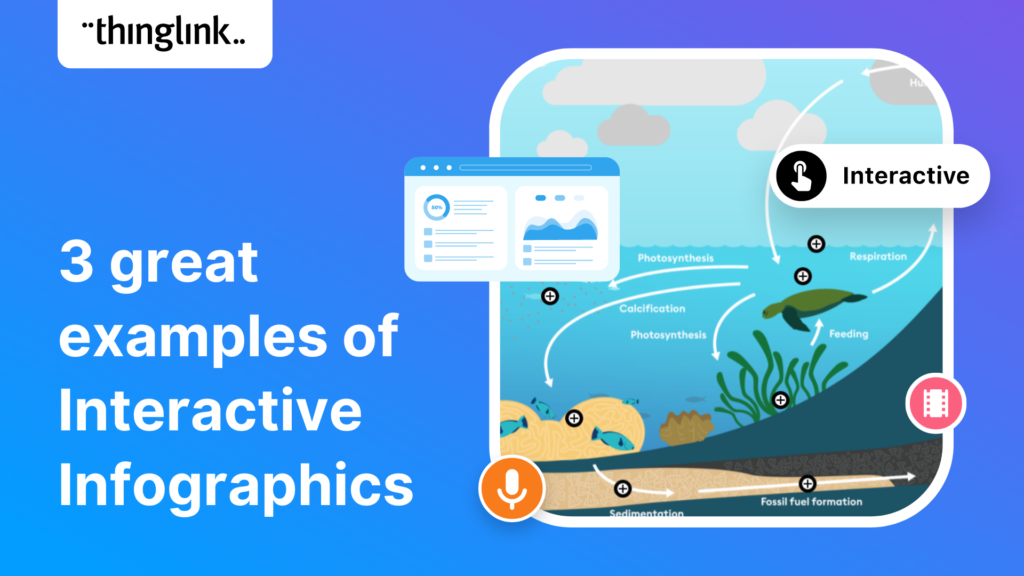
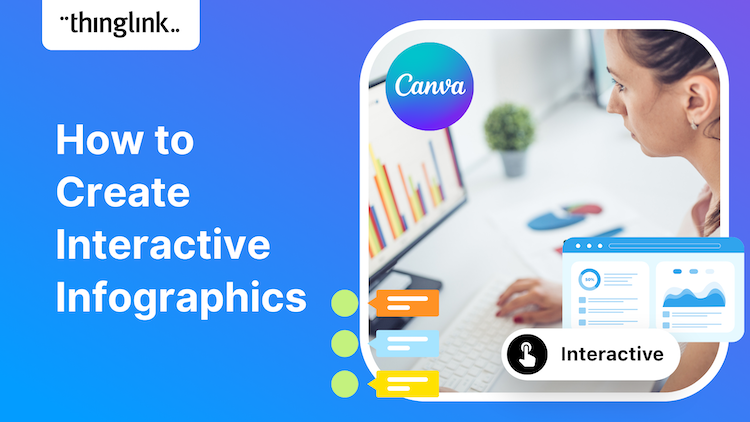
Infographics are the fastest and easiest way to present any complex information. In this blog we’ll show you how to create interactive infographic designs even...
How can you make engaging interactive infographics if you’re not a professional graphic designer? In fact, creating this type of visual content can be really ...
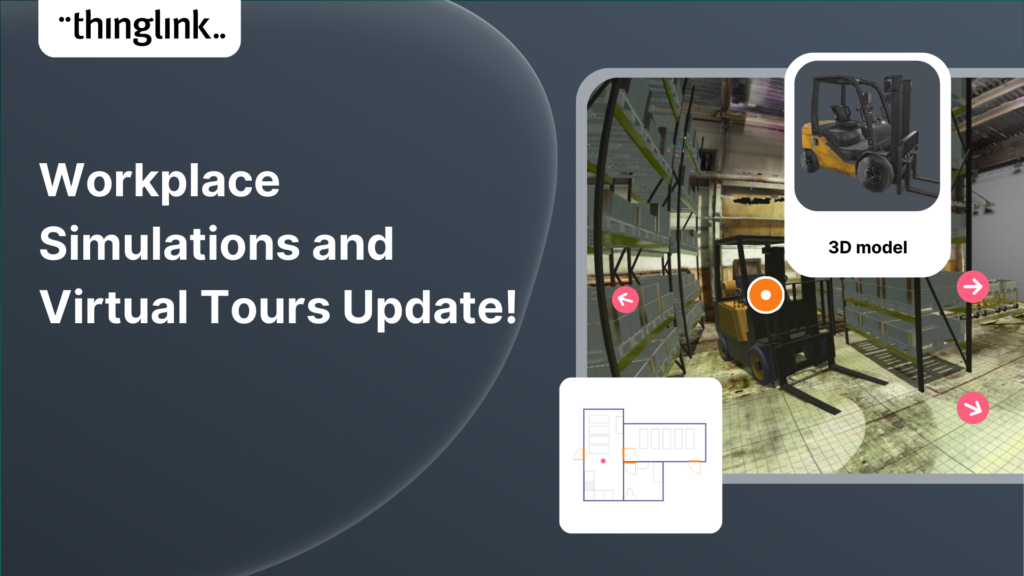
Increase the effectiveness of your online training with multimedia interactive simulations and virtual tours. eLearning course content creation is easy with ThingLink!...
Your viewers won’t get lost with this brilliant new virtual tour feature! Our latest ThingLink update enables you to add a floor plan or ‘mini map’ that shows...
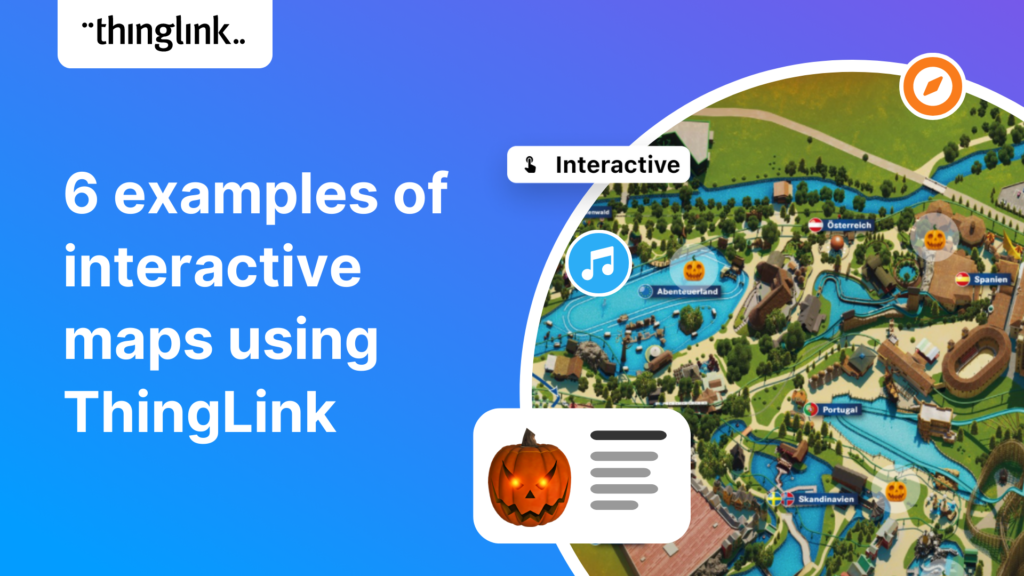
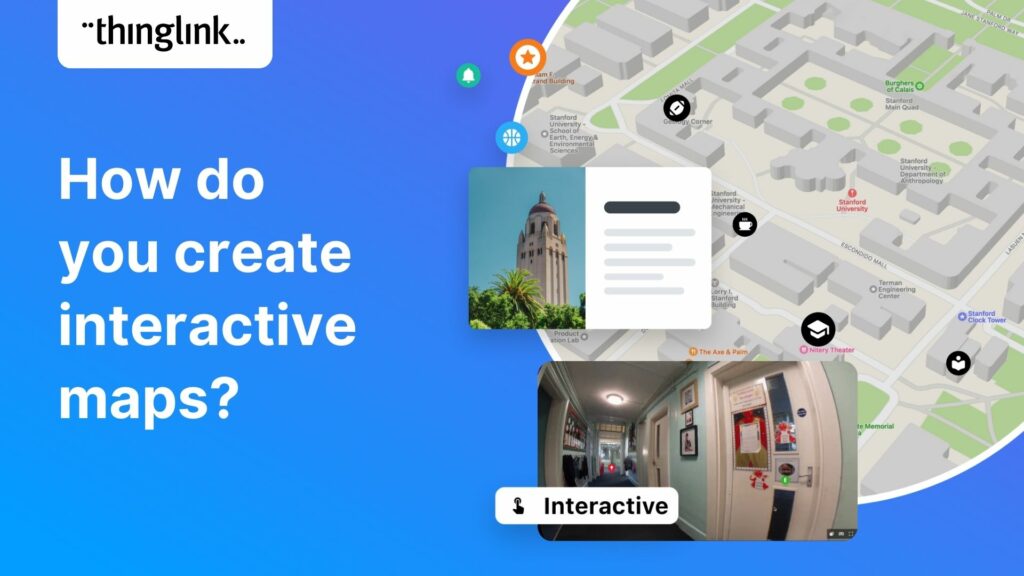
Some inspiring examples of interactive maps created by ThingLink users. Thanks to mobile apps like Google maps, we are now all used to using maps every day that...
Kyla Ball
4 min read
“There are those who follow maps, and those who make them.” Alberto Villoldo How to create interactive maps You don’t need to invest in an expensive...
Kyla Ball
2 min read
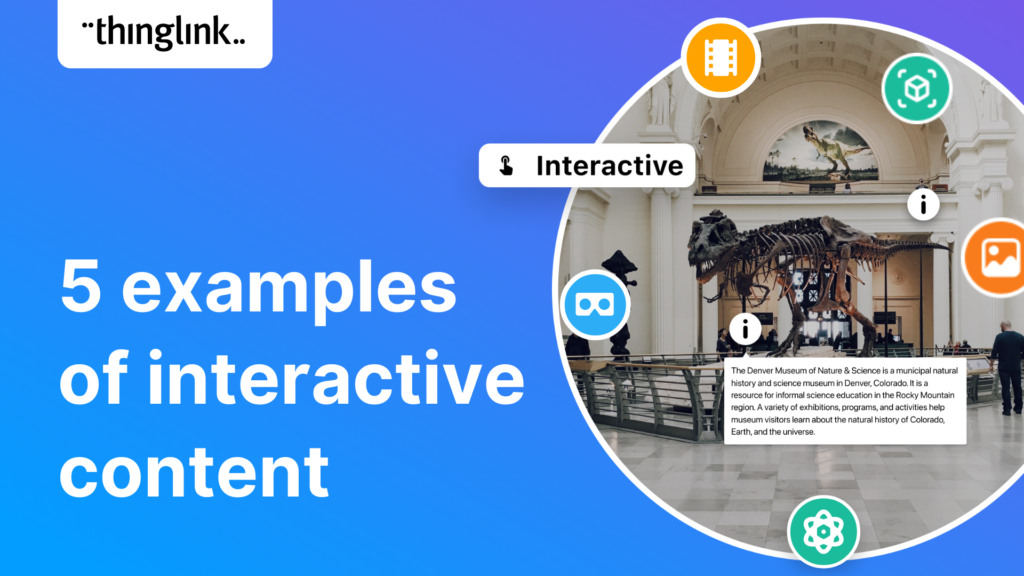
5 types of interactive content you can easily create today with ThingLink September 14, 2022 / 4 minutes of reading / By Louise Jones Stuck ...
Kyla Ball
5 min read
What is interactive content? The opposite of static or passive content, interactive content is one which users actively participate in or engage with. This...
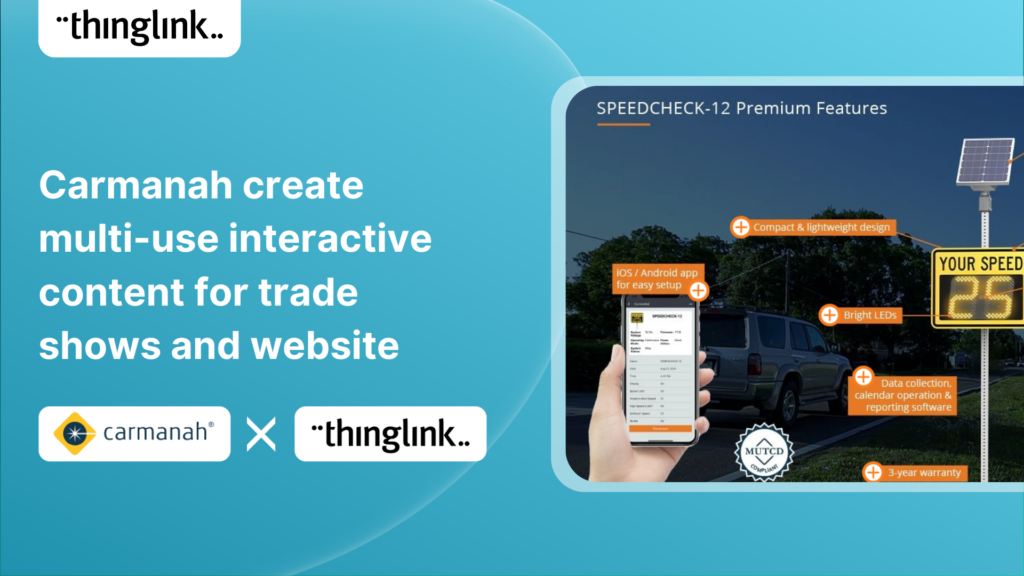
Background Carmanah is a company based in British Columbia, Canada, that helps improve road safety with a range of products including flashing beacons, radar speed...
Kyla Ball
5 min read
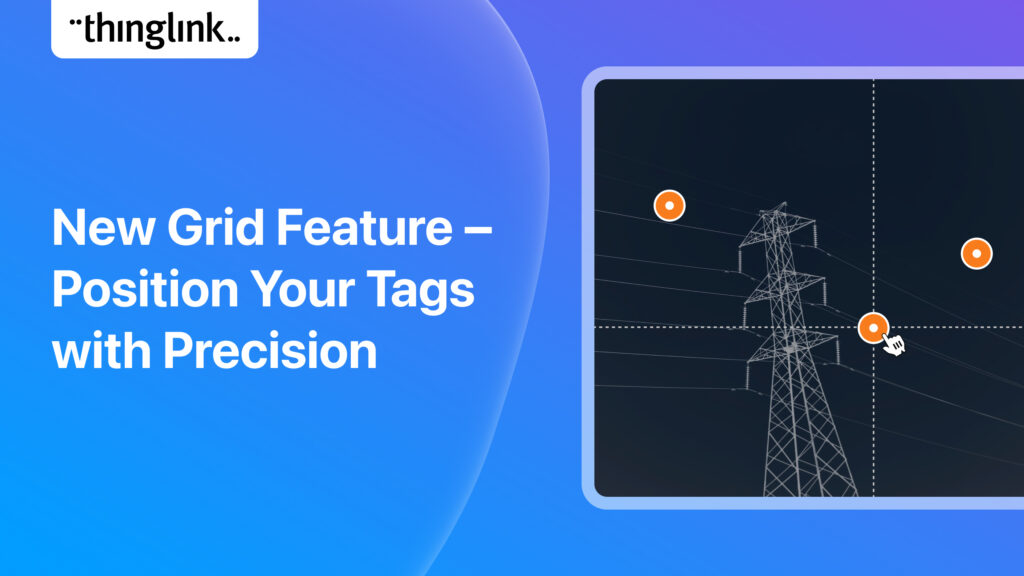
It’s now even easier to create slick and professional-looking interactive content with another of ThingLink’s handy new content tools. The Grid Feature allows...
ThingLink has been placed in an impressive three separate categories by Capterra, the free online service that helps organizations choose the right software. In...
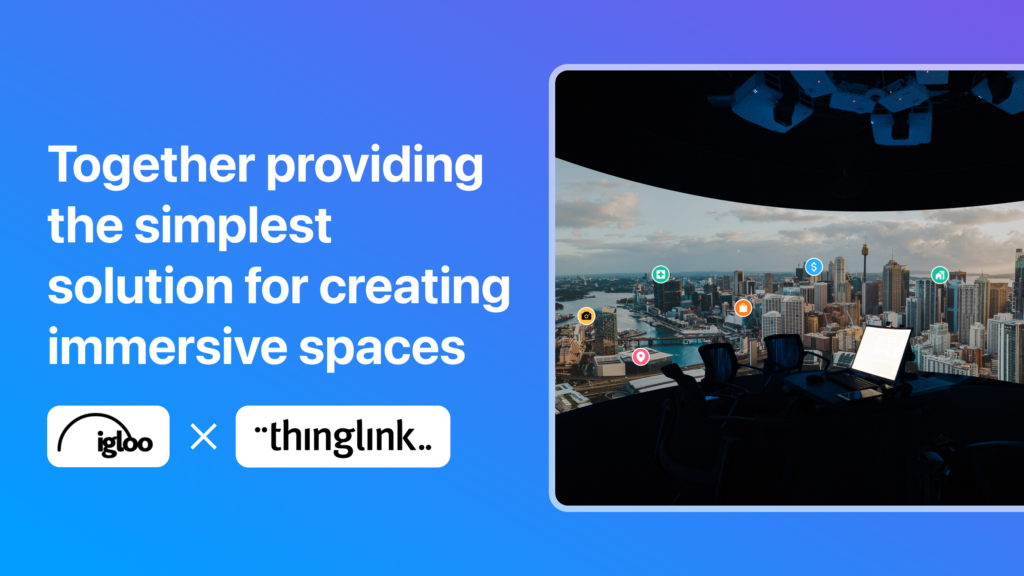
With over 20 years of visionary experience between them, ThingLink and Igloo Vision have crafted a reality for the future of immersive spaces. ThingLink is the ...
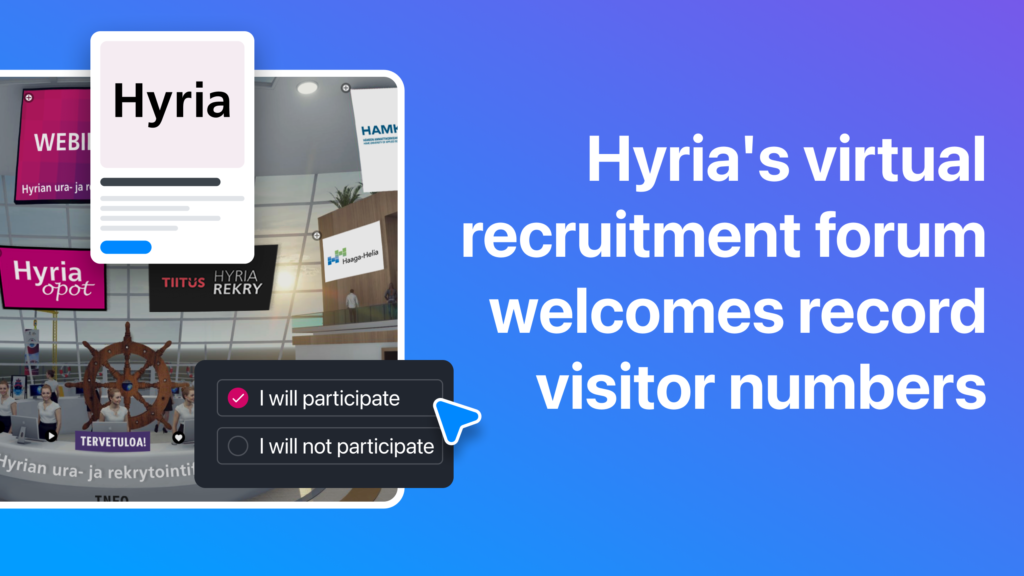
Are you looking for a way for your students to find out about job opportunities, learn about education options and get feedback on their CVs? When they couldn’t...
Kyla Ball
7 min read
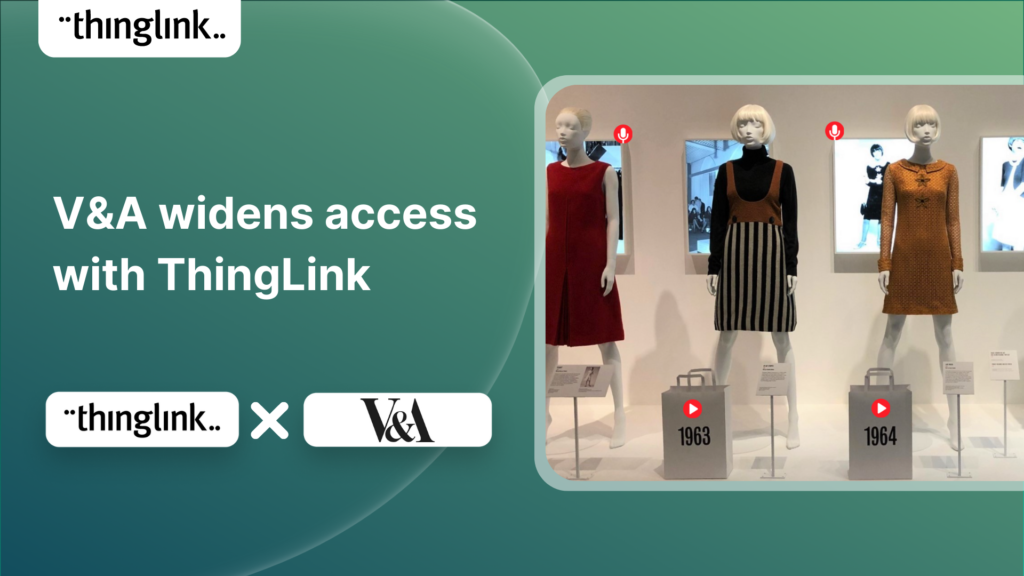
The Scottish design museum creates interactive learning resources that reflect the innovative, global and democratising themes in their recent exhibitions. This...
Using ThingLink for your business or organisation? Great news: our team has curated a collection of top 10 examples of ready-to-use Canva design templates that ...
Kyla Ball
4 min read
Luxury holiday accommodation brand Hidden Highland Retreats used ThingLink to create 360 tours to improve their website and service experience as well as train ...
Kyla Ball
5 min read
Newspapers across the globe are moving increasingly online and in many cases behind pay walls. But with so much free content to compete with, how do regional titles...
Kyla Ball
6 min read
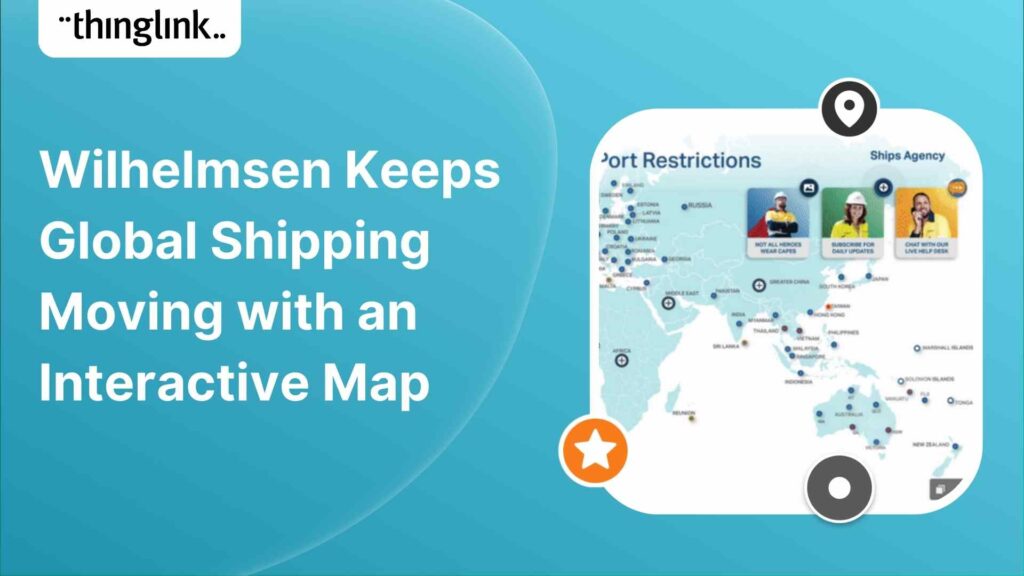
Wilhelmsen is a global maritime industry group, employing more than 21,000 people across 75 nations. The Wilhelmsen group operates the largest maritime network ...
Wherever high school students plan to study, most would ideally like to do an on-campus visit to the schools that they are considering. But the covid pandemic made...
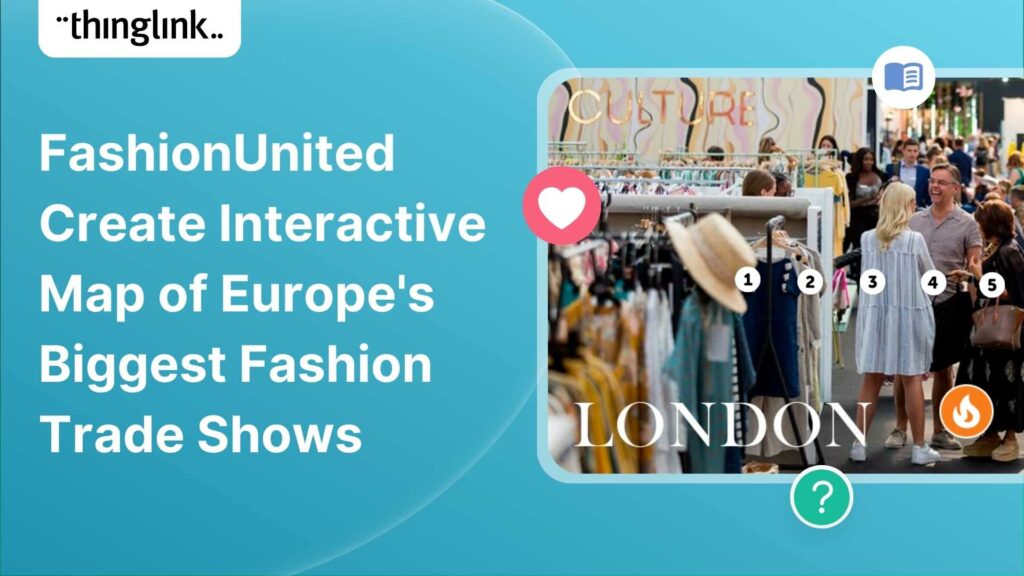
Virtual tours are most commonly associated with 360/VR images, videos or still images of a physical space. FashionUnited shows how ThingLink expands this notion...
Making maps and aerial views actionable with interactive hotspots is one of the top use cases amongst all ThingLink user segments. Maps are especially conducive...
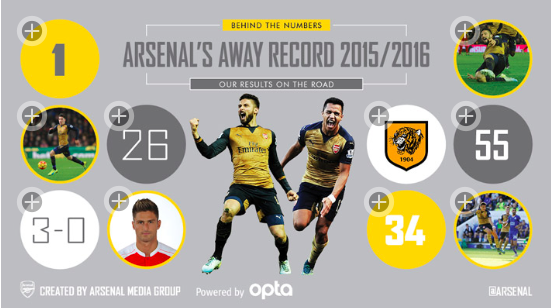
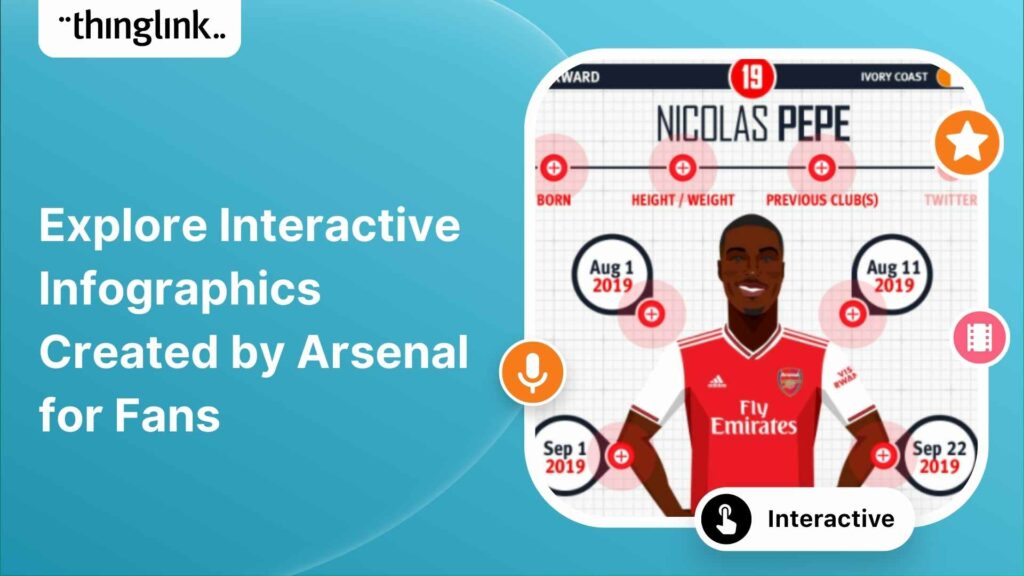
English football club Arsenal used cleverly designed interactive illustrations to create an immersive experience for their fans to meet each player. While navigating...
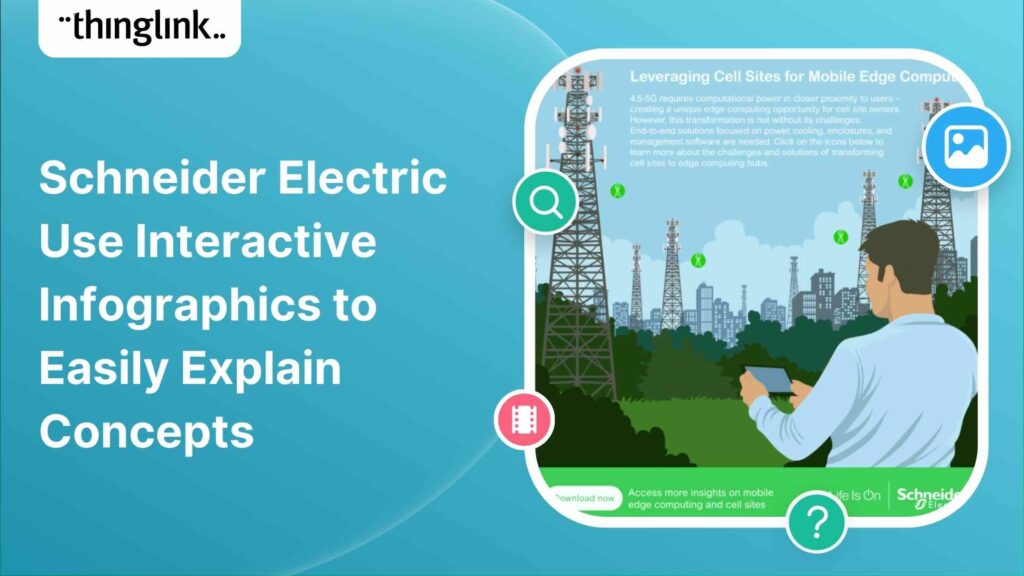
Schneider Electric SE is a French multinational company that specializes in digital automation and energy management. They are long-time ThingLink users who...
Kristen Muszynski is the director of communications at the Department of the Secretary of State in Maine. Some time ago her colleague Tammy Marks, director of the...
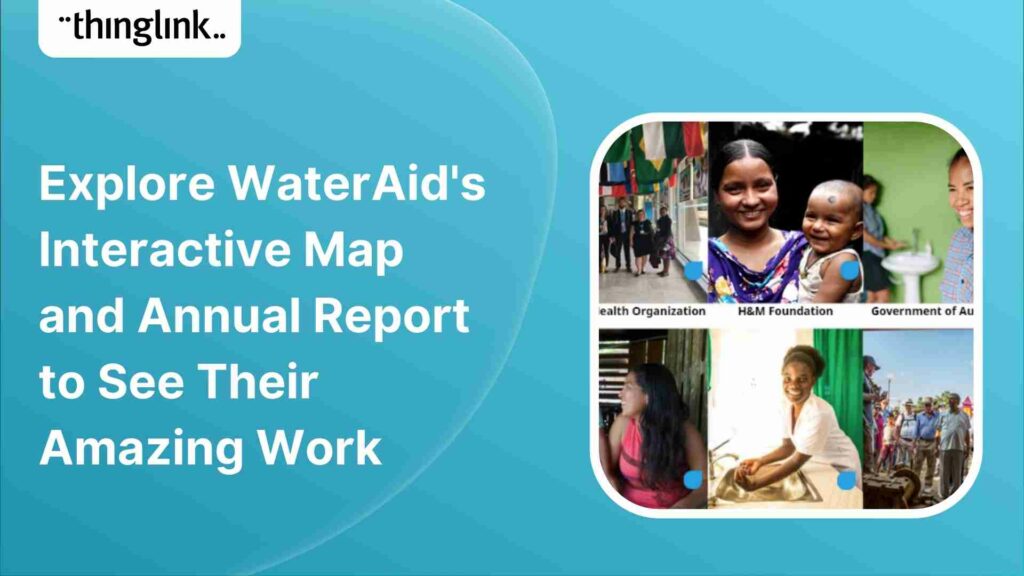
WaterAid is a remarkable organization who focuses on making clean water, decent toilets and good hygiene normal for everyone, everywhere. Read more about ...
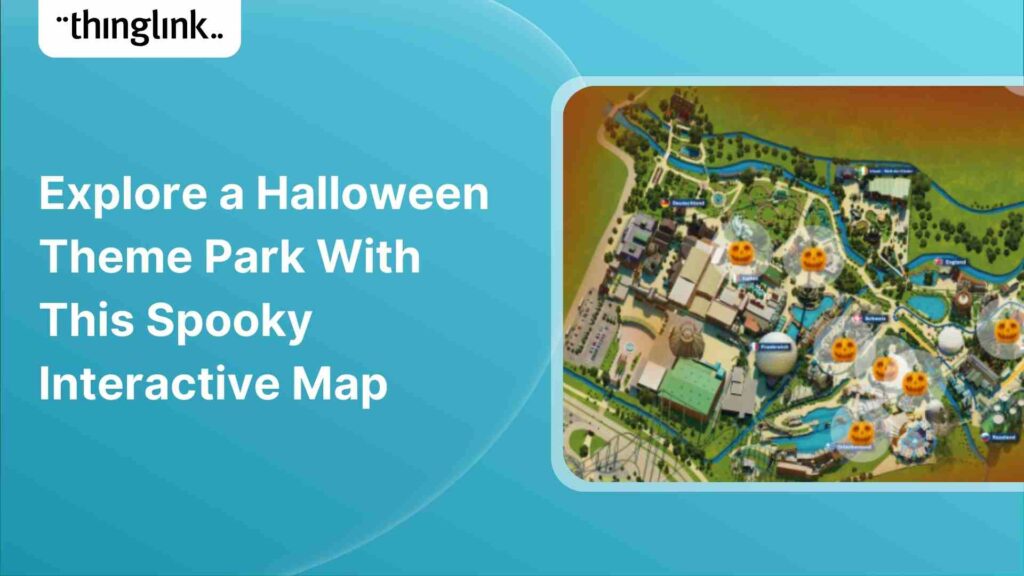
BOO! It is Halloween and at the Europa-Park theme park and resort! Seeking to create a stunning, visual experience to bring their website content to life,...
In 2012, ThingLink was the first media platform to bring interactive image sharing to Twitter. The feature was hugely popular especially among customers who use...
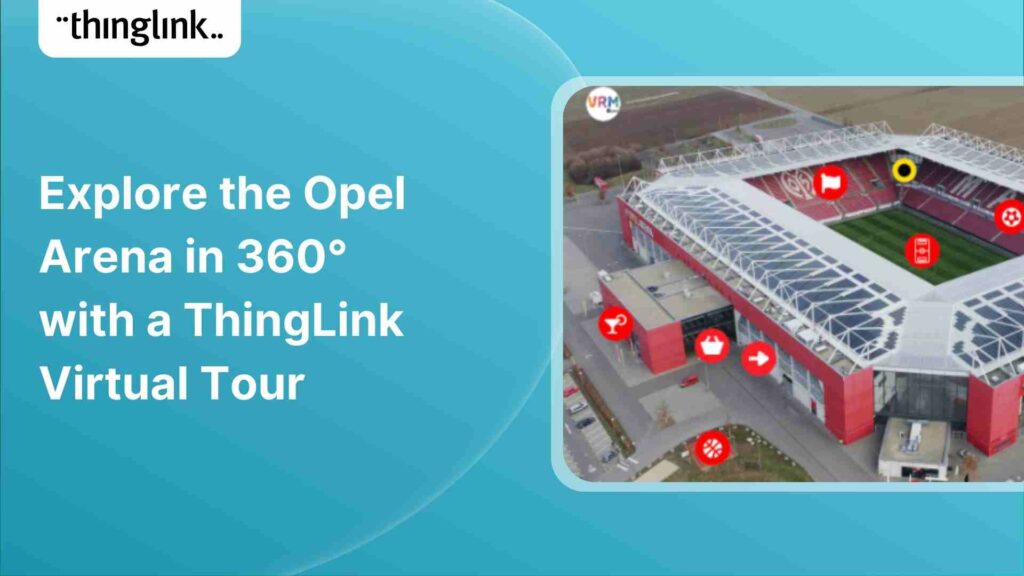
VRM is a regional media company that uses ThingLink in this article VRM Arena Tour to give readers the experience of touring the Opel Arena in Germany . The...
Many real estate agents from small local shops to large commercial brands are leveraging interactive content to tell more visual stories or market properties more...
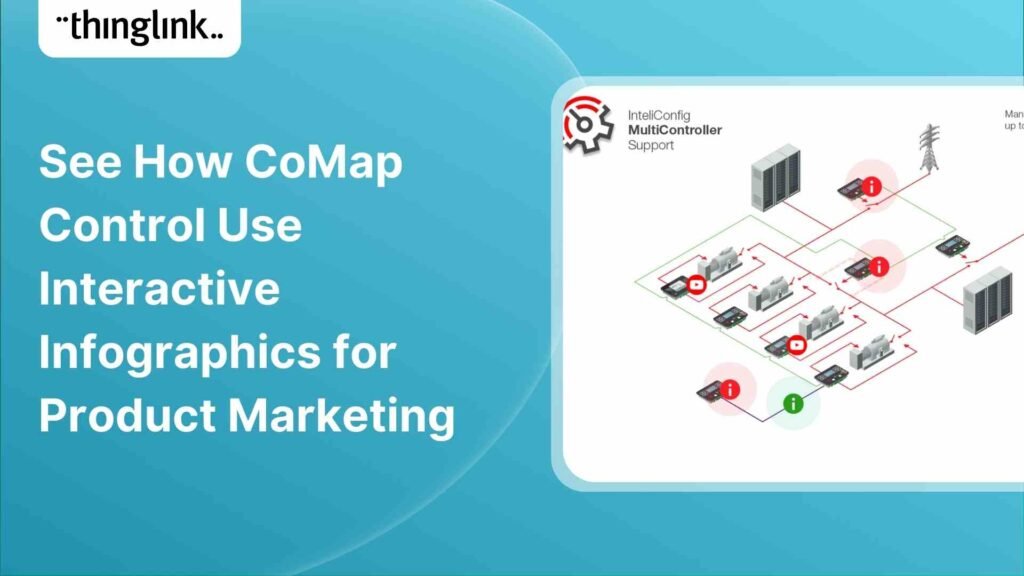
Marketing your products visually in today’s web environment is critical when it comes to capturing attention and presenting information in an engaging way...
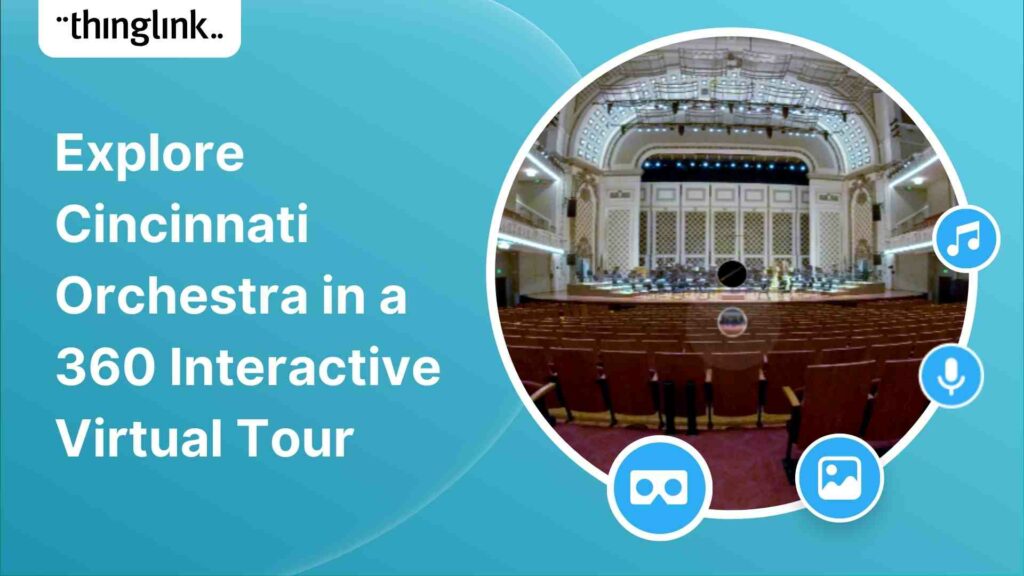
Take a virtual trip directly into the conductor’s chair of the Cincinnati Orchestra – with this interactive 360° tour of Music Hall, Cincinnati....
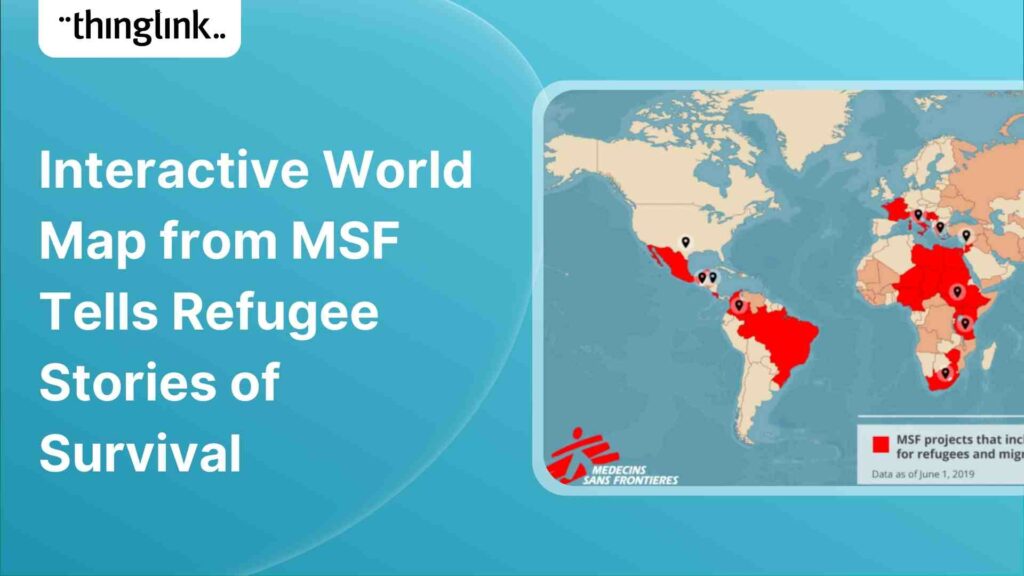
MSF (Medecins Sans Frontieres/Doctors Without Borders) provides medical assistance to people affected by conflict, epidemics, disasters, or exclusion from ...
The TODAY Show provides their readers with these handy guides to clean everything on their checklist, room by room. Just click on...
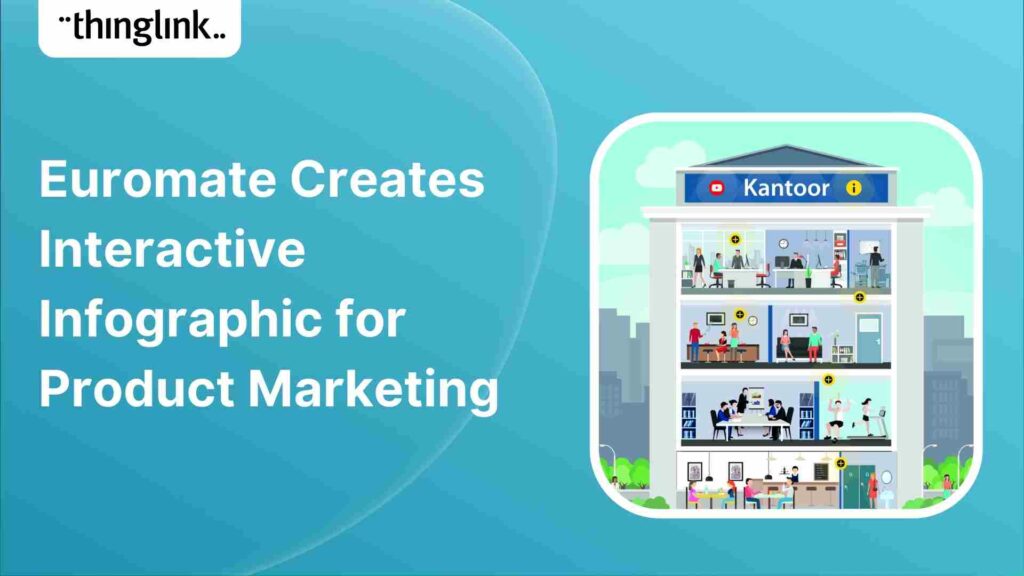
Air quality experts Euromate use a ThingLink interactive infographic to market some of the services they provide. Poor air quality creates an unhealthy workplace...
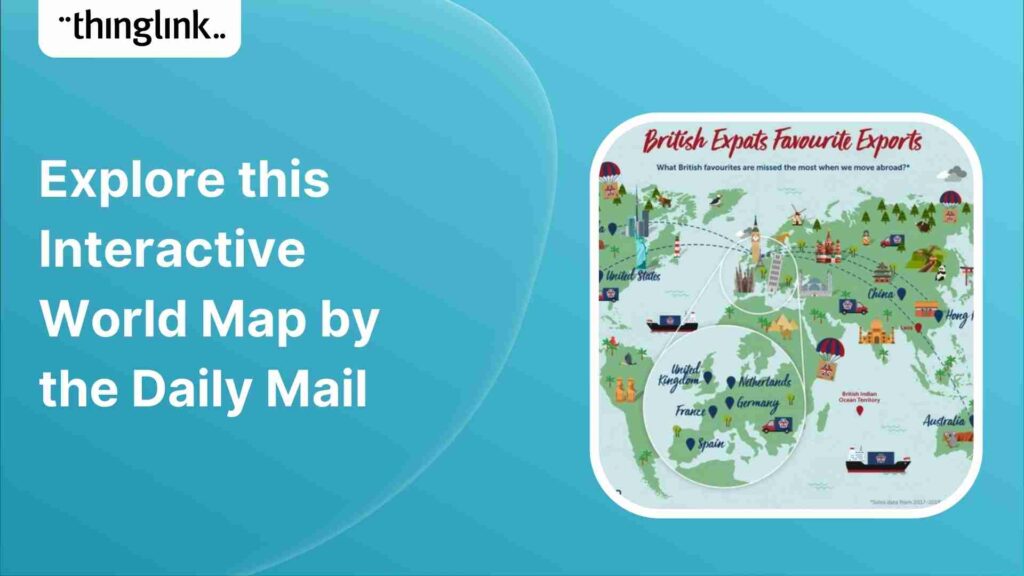
The Daily Mail uses an interactive map within their editorial article to showcase what British food favorites are missed most when moving abroad based on the most...
VG/Dressman creates an interactive “shop the look” experience for a new clothing line using ThingLink. Customers can scroll through this landing page...
A devastating fire destroyed the National Museum of Brazil in 2019. Leonardo Coelho, a journalist and a student at the Federal University of Rio de Janeiro, had...
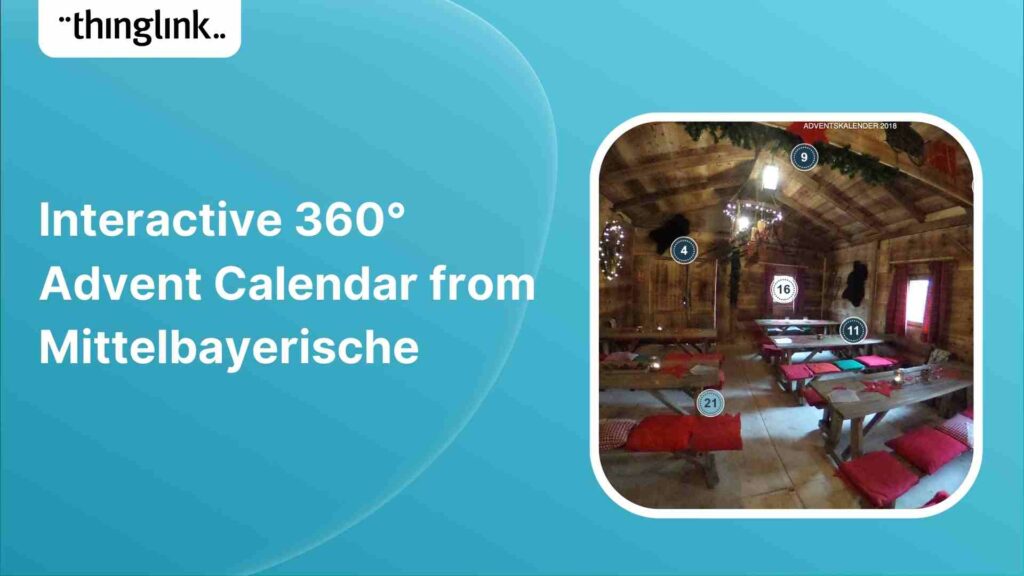
Using ThingLink’s 360° image editor, Mittelbayerische creates an interactive advent calendar for their readers. Each hotspot includes a variety of surprises,...
Academic Publisher Routledge uses ThingLink to create a helpful infographic for teachers to explore while choosing books to use in the classroom. The infographic...
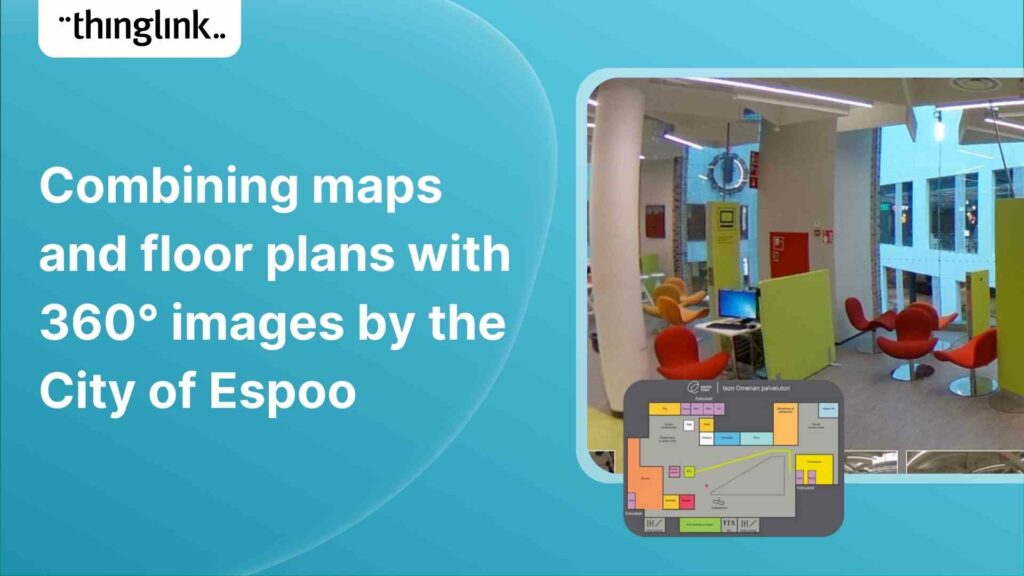
City of Espoo – interactive floor plan layered with 360° images Building interactive maps and floor plans with ThingLink is a popular way to educate...
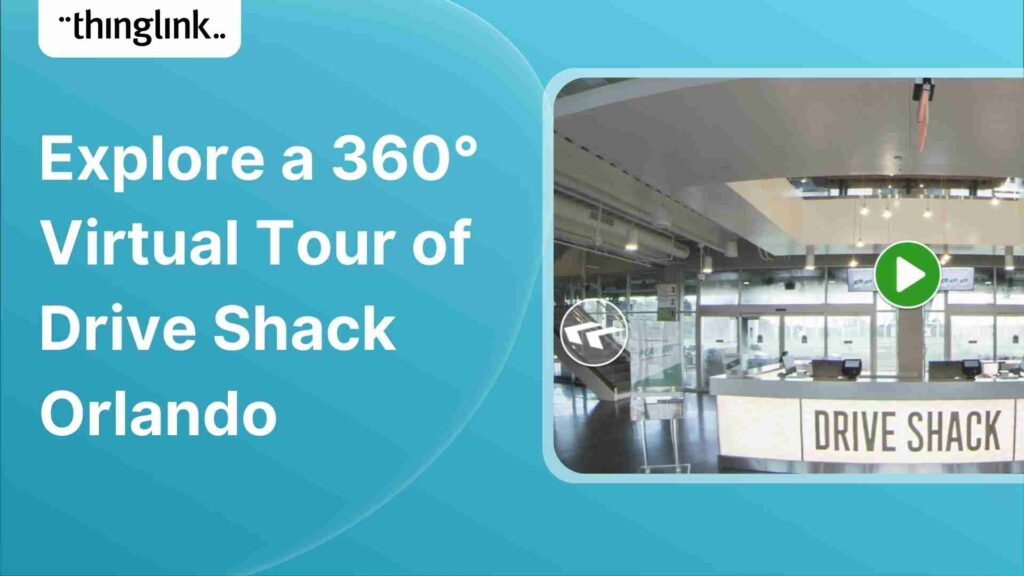
Drive Shack Orlando, an entertainment company that combines golf, competition, dining, and fun, takes customers on a walkthrough tour of their stunning entertainment...
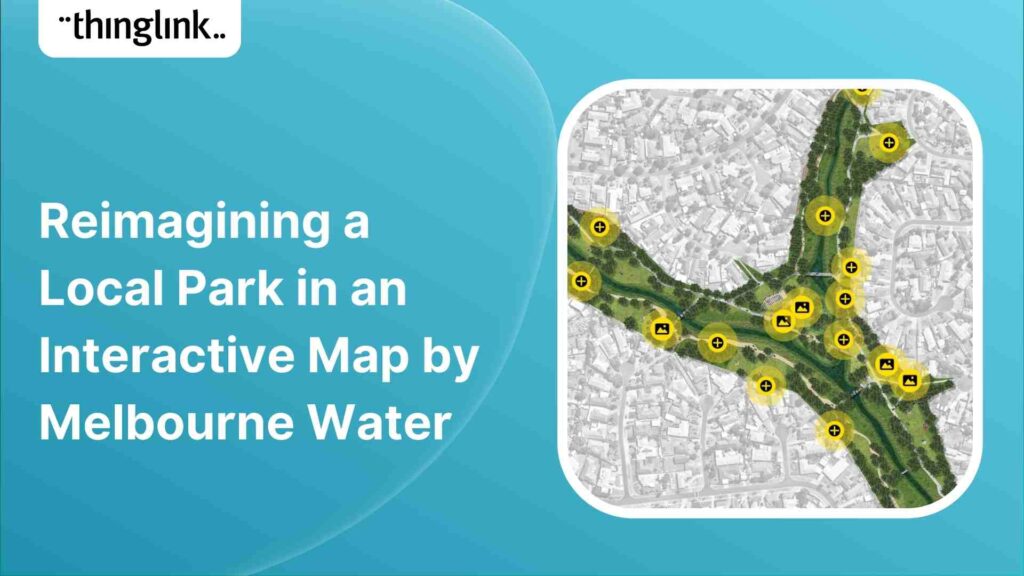
The Melbourne Water team has been working with residents, representatives from community groups and project partners to reimagine and co-design a section of Arnolds...
ThingLink user: Travel Slide 360° Cruise Ship (click to explore live or embedded below) Description: Travel Slide uses ThingLink to uniquely market their travel...
ThingLink user: Lakefront at Keystone (click to explore live or embedded below) Description: JLL Midwest’s marketing team using an interactive aerial map...
ThingLink user: WDIV Local 4 (click to explore live or embedded below) Description: With the royal wedding quickly approaching May 19, 2018, WDIV Local 4 utilizes...
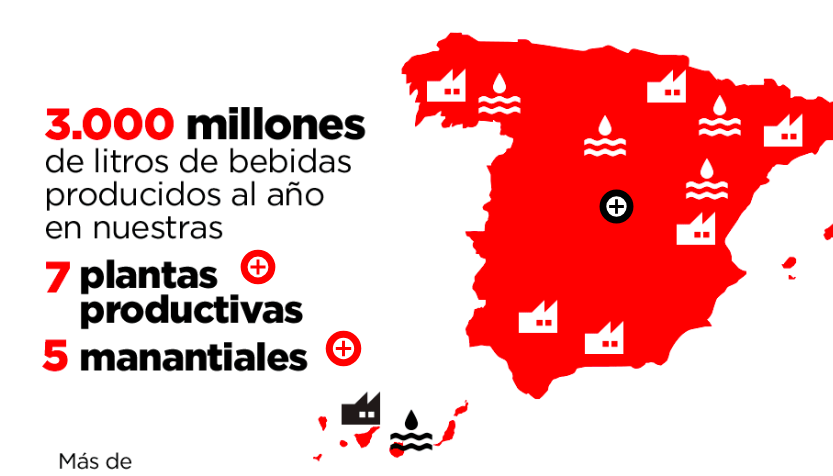
ThingLink user: Coca-Cola Spain (click to explore live or embedded below) Description: Coca-Cola Spain masters the art of digital storytelling by using interactive...
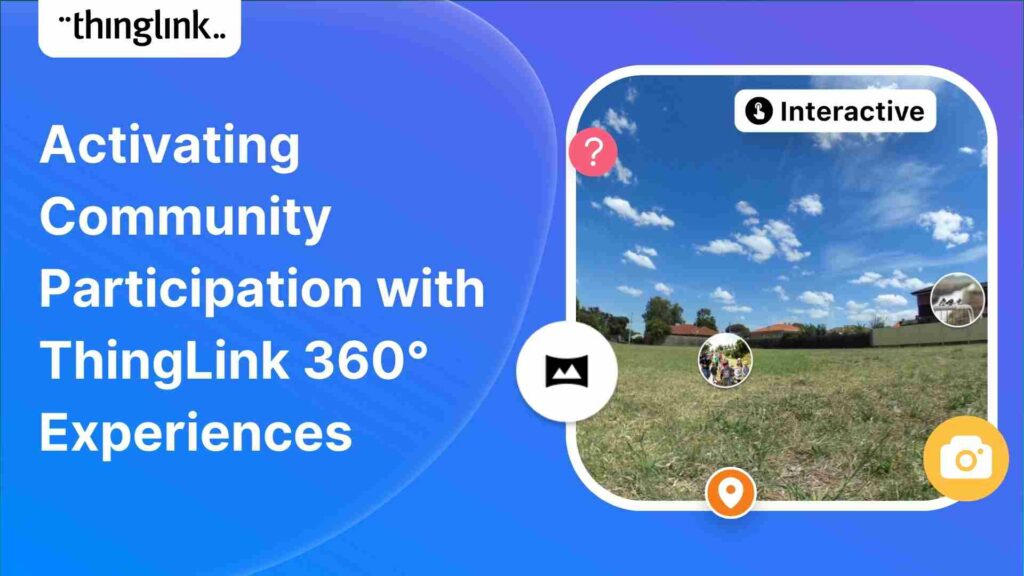
Looking for a unique and engaging way to activate participation in your initiative, cause, challenge, or project? Let’s take a look at how two organizations...
ThingLink user: Virgin Media (click to explore live or embedded below) Description: Virgin Media uses ThingLink actively within articles to tell their digital...
Trends in digital advertising have shifted from banner ad-units to native advertising. Blending ads as editorial content has become a much more engaging and productive...
ThingLink user: JLL Chicago (click to explore live) Description: How to keep a digital audience engaged is a key question that all digital marketers must contemplate...
ThingLink user: Schwäbische Zeitung (click to explore live) Description: Over 100 years ago this hotel was frequented by the rich and famous of Germany, but ...
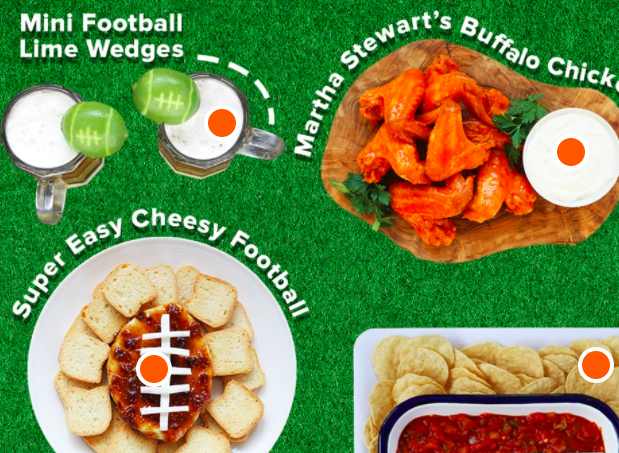
ThingLink user: Today Party Spread (click to explore live) Description: Using ThingLink, Today “takes the guesswork out of creating the perfect table scape...
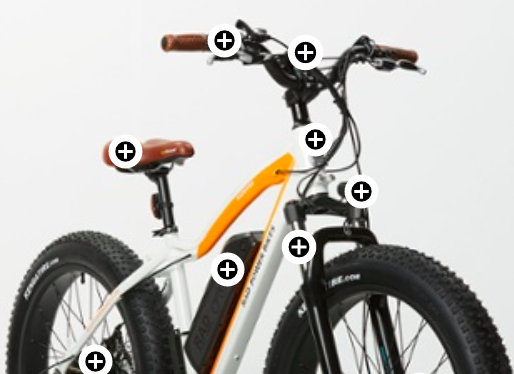
ThingLink user: Rad Power Bikes Tech Specs (click to explore live) Description: ThingLink is an ideal solution for providing detailed product tech specs on their...
ThingLink user: Walmart (click to explore live) Description: “Eye-tracking studies show internet readers pay close attention to information-carrying images....
ThingLink user: KiKA – Beutolomäus Series Description: The series about Beutolomäus, the loyal and faithful fellow of Santa Claus, ranks among the most...
ThingLink user: WaterAid 360° Experience (click to explore live) Description: WaterAid is a magnificent organization that has teams in 34 countries...
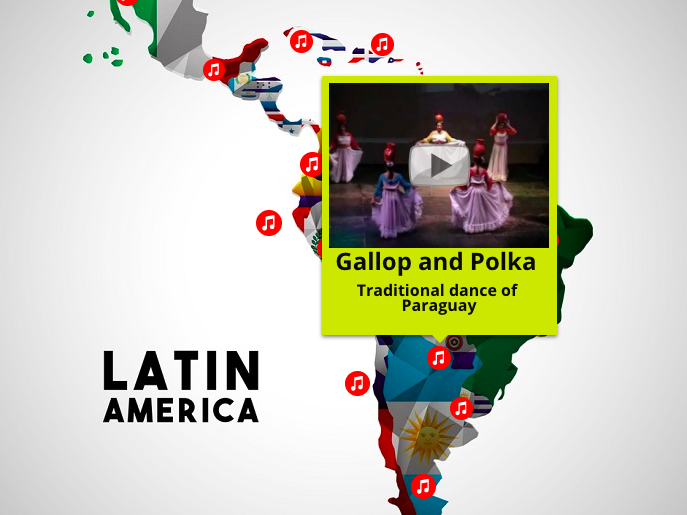
ThingLink user: Todo-Mail (click to explore live) Description: The countries of Latin America are famous for their ellaborate and beautiful dance routines. Todo-Mail...
ThingLink user: Sportsnet Canada (click to explore live) Description: Some of the world’s leading soccer nations did not qualify for the upcoming World Cup...
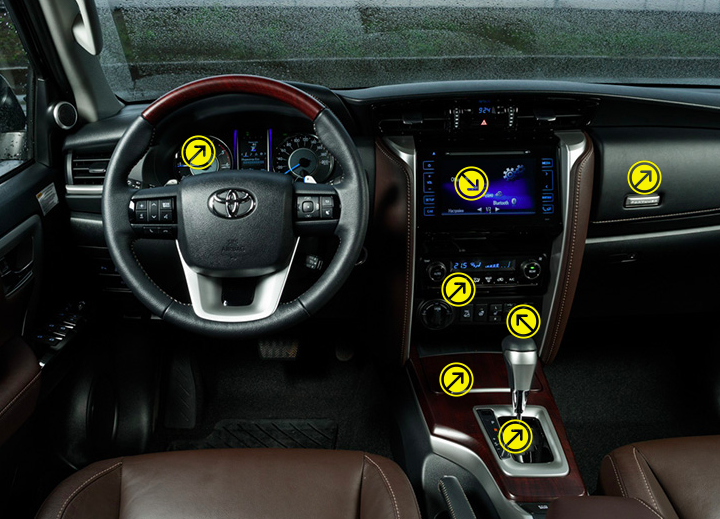
ThingLink user: Motor (click to explore live) Description: Motor uses a ThingLink interactive image to deconstruct the various cars they review online. Hovering...
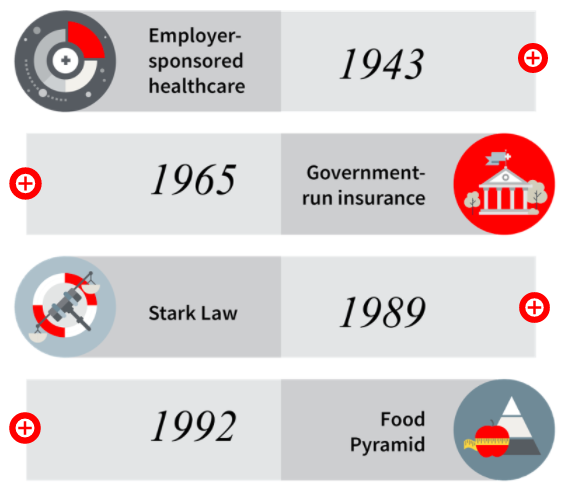
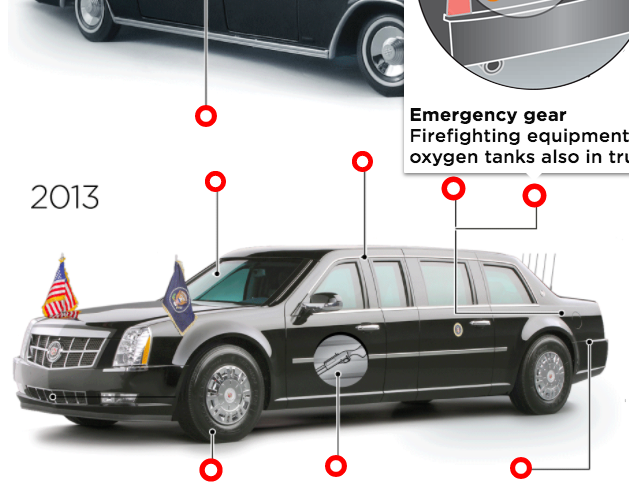
ThingLink user: Dallas News (click to explore live) Description: Dallas News uses a ThingLink interactive infographic to compare President JFK’s limousine...
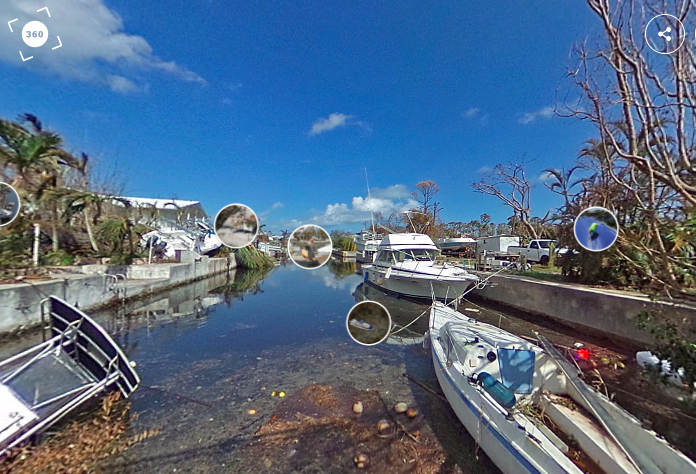
ThingLink user: Univision Map & Local 10 News 360 Tour (click to explore live) There is an infinite number of creative use cases to use ThingLnk for covering...
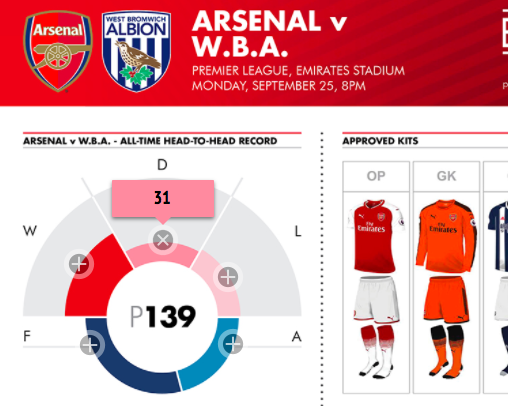
ThingLink user: Arsenal (click to explore live) Description: Arsenal uses ThingLink to debrief each game with an interactive infographic. Hovering over the hotspots...
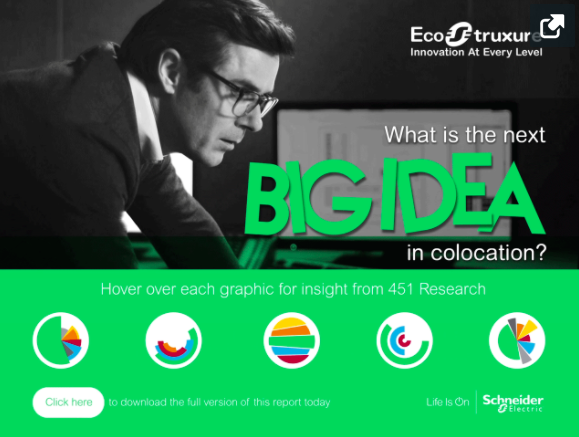
ThingLink user: Schneider Electric (click to explore live) Description: Schneider Electric conducted a client research survey to better understand their current...
While creating interactive 360 images was previously limited to your browser, ThingLink is happily announcing that we are releasing our brand new mobile editor,...
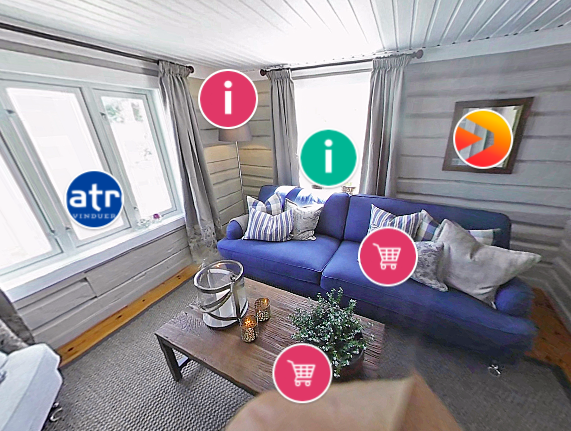
ThingLink user: TV3 Norway (click to explore live) Description: A popular home redecoration show on the TV3 network called Eventyrlig Oppussing creates an interactive...
Using ThingLink on Facebook gives you a unique way to engage your readers and make them spend more time with your update. In this post you will find 4 ways to use...
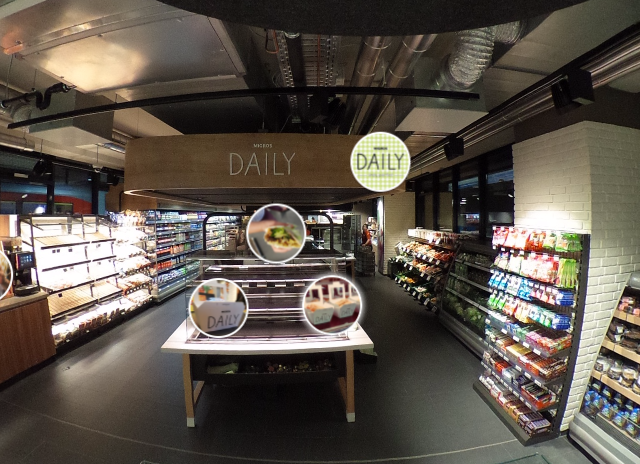
ThingLink user: Migros Virtual Store (click to explore live) Description: Migros is large supermarket chain in Switzerland and they use ThingLink to give a 360°...
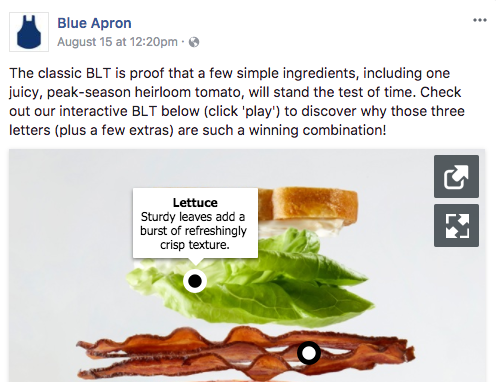
ThingLink user: Blue Apron Facebook Post (click to explore live) Description: Blue Apron deconstructs the perfect BLT for their Facebook audience with this interactive...
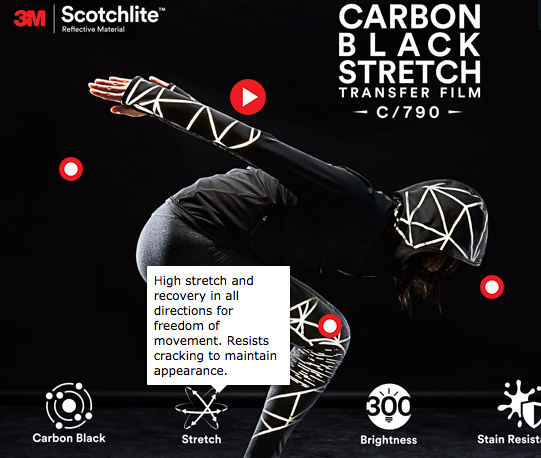
ThingLink user: 3M (click to explore live) Description: Enhance your press releases with an interactive image that summarizes all key selling points in one shareable...
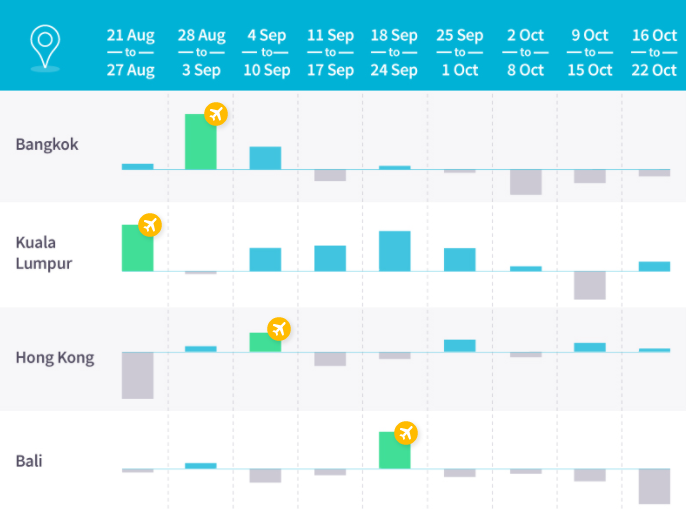
ThingLink user: Asia One (click to explore live) Description: Asia One writes an article featuring the best times to book a flight for Christmas holiday and accompanied...
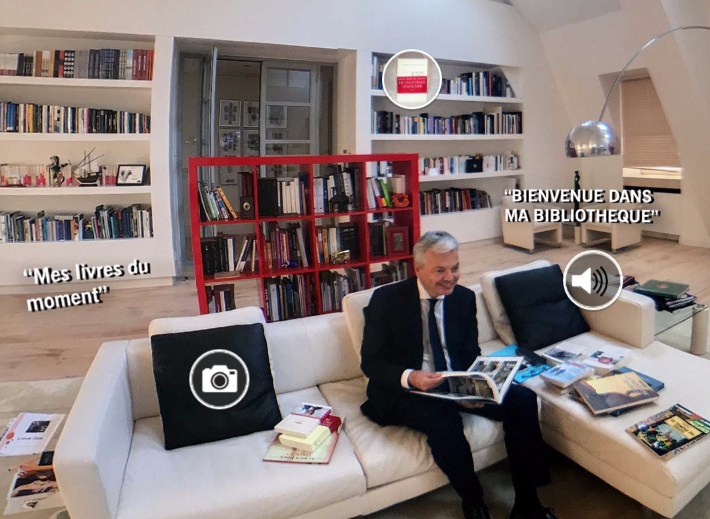
ThingLink user: L’Echo 360 tour (click to explore live use case) Description: L’Echo has been the most consistent and creative users of ThingLink’s...
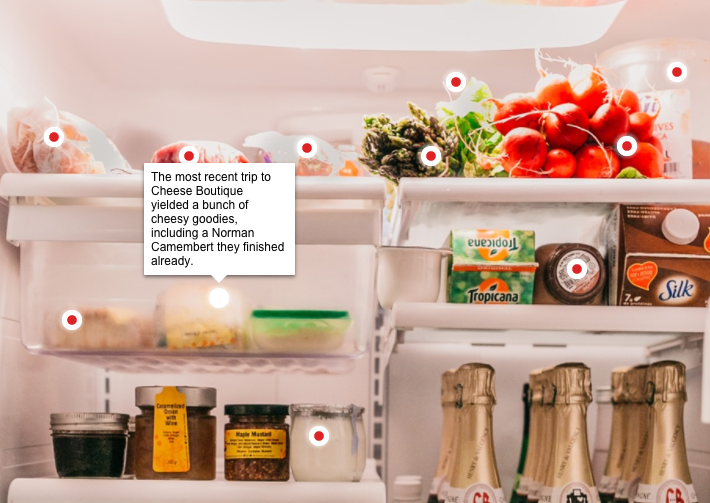
ThingLink user: Toronto Life (click to explore live) Description: Getting readers to stay on your website longer is a key KPI for any publishing company. Toronto...
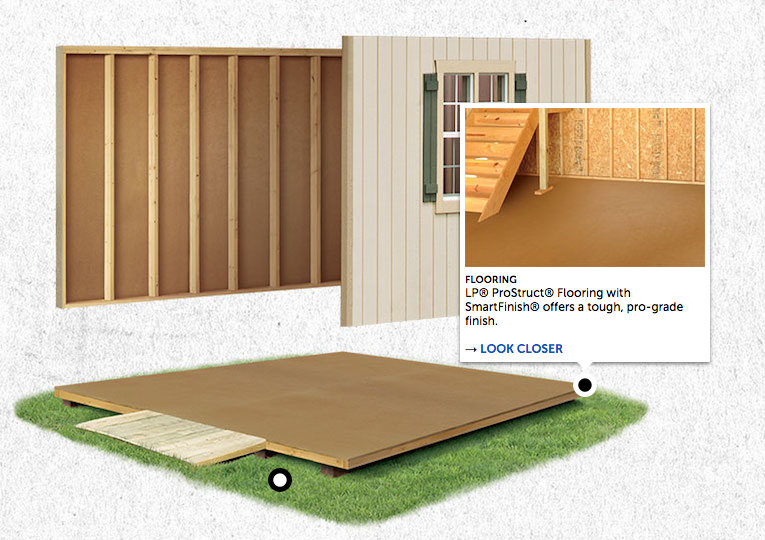
ThingLink user: Bob Vila (click to explore live) Description: Bob Vila uses ThingLink to create more engaging interactive content within their web articles. In...
Earlier this year, Punch Communications worked with ThingLink to execute a 360° competition experience for Habitat – one of the agency’s top brands. The...
ThingLink user: FashionUnited (click to explore live) Description: This interactive tour from FashionUnited consists of six 360° photos, which enables readers...
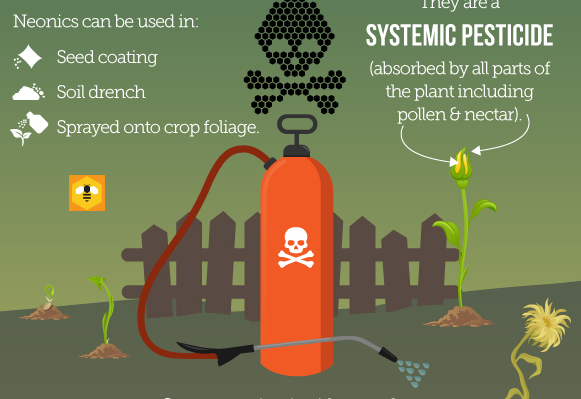
ThingLink user: Sun Leisure (click to explore live) Description: The global bee population has been plummeting at an alarming rate over the last several years...
ThingLink user: Callaway Golf (click to explore live) Description: In this week’s feature we detail an interactive Father’s Day Gift Guide from Callaway...
ThingLink user: GE Power (click to explore live) Description: GE Power markets a new product by using a visual interactive infographic powered by ThingLink. Hovering...