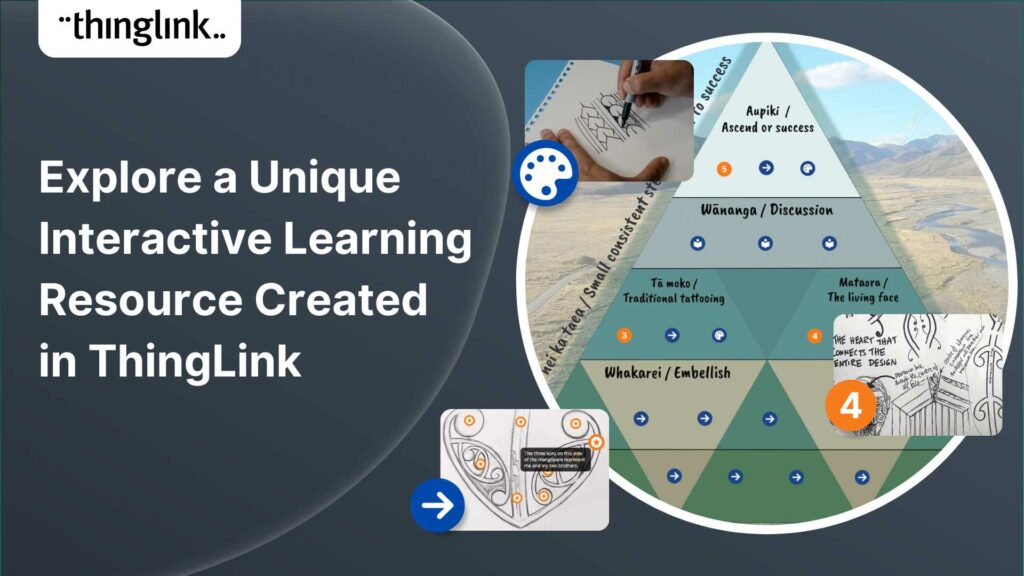
Katrina Lilly is a teacher at Te Aratai College in New Zealand, and recently finished a Masters in Contemporary Education at AcademyEx. As part of her masters she...
 Kyla Ball
6 min read
Kyla Ball
6 min read
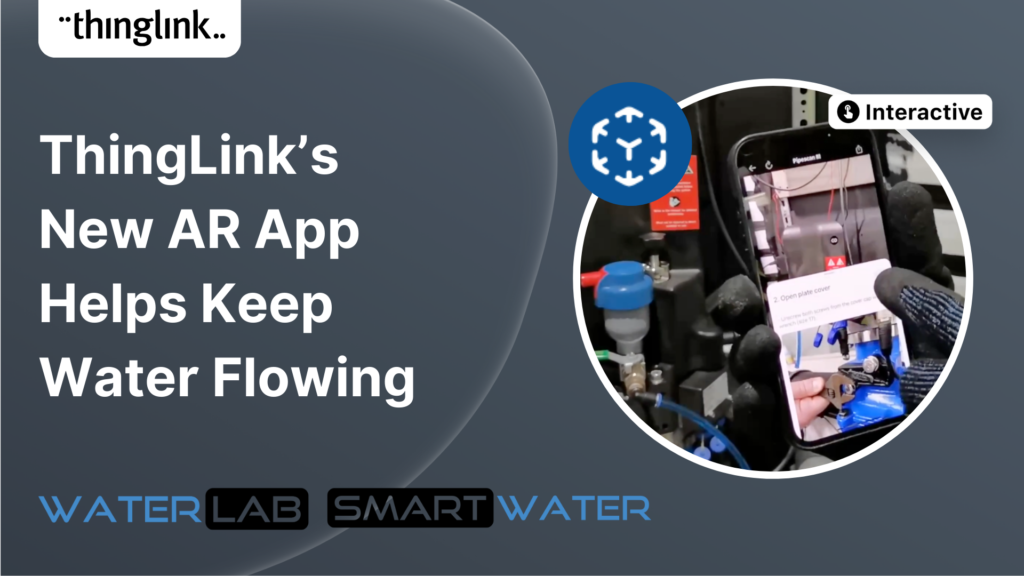
ThingLink’s AR Solution Helps Operators Troubleshoot Critical Water Network Issues Clean, safe water on demand is a fundamental expectation and mainstay...
Kyla Ball
7 min read
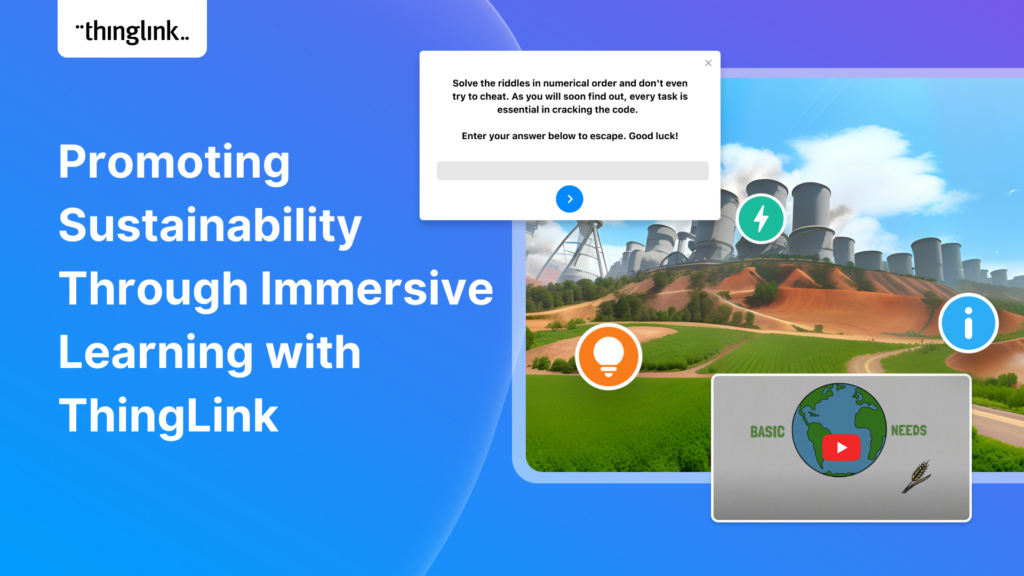
The world faces numerous sustainability-related challenges, threatening the future of our planet. Those issues are often hard to grasp without direct exposure to...
Discover the future of nursing education with the “Care for Europe” project, where immersive tours and interactive modules seamlessly prepare students...
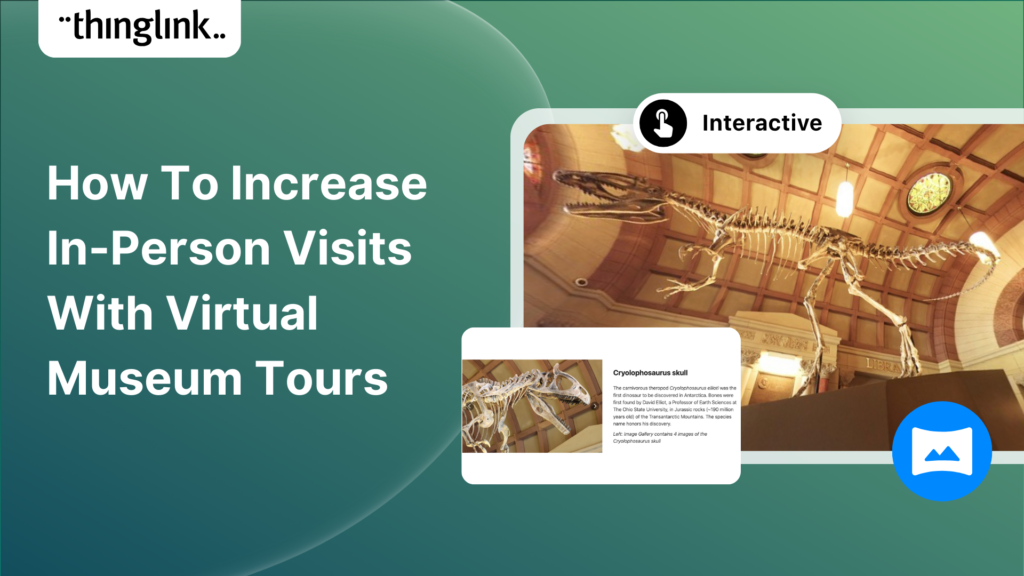
Museums worldwide are finding innovative ways to enhance their visitor experiences both on and offline. One such innovation is the virtual museum tour. Perhaps ...
Kyla Ball
4 min read
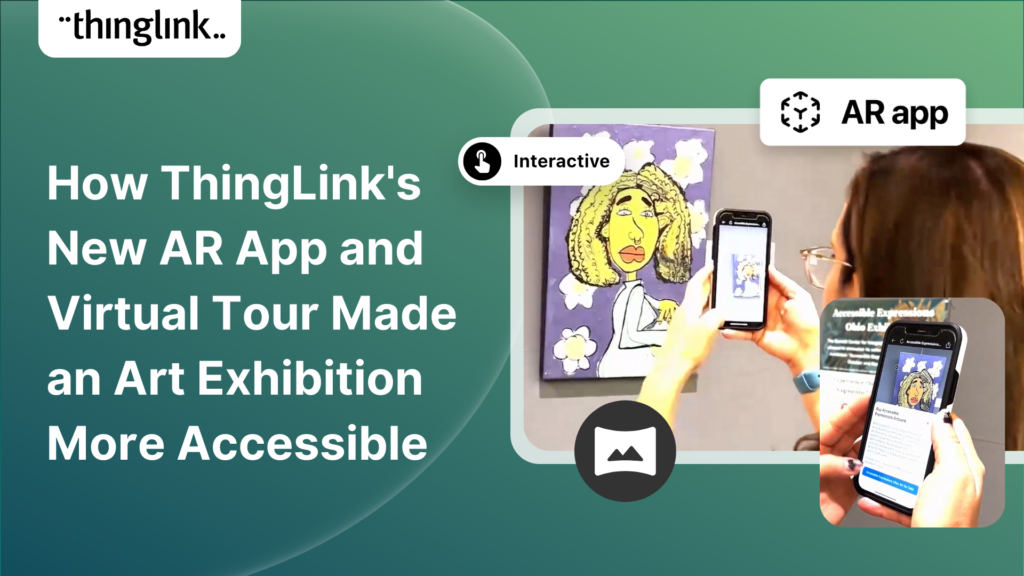
In the fall of 2023, Ohio State University’s College of Arts and Sciences Office of Distance Education (ASC ODE) began a collaboration with the college’s...
Kyla Ball
6 min read
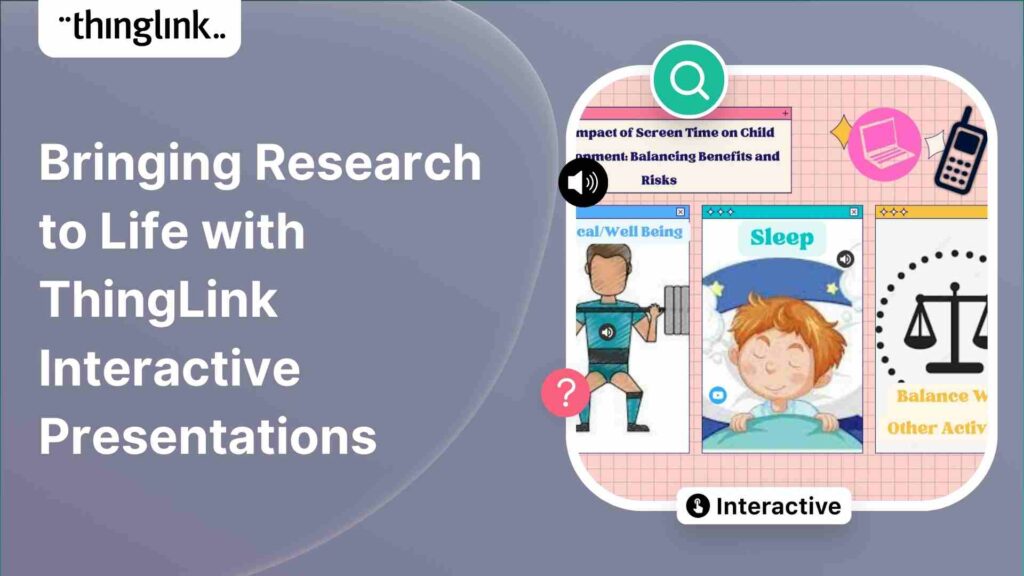
Regardless of subject, presenting your data and findings in an engaging and understandable way can be a challenge! Fortunately, ThingLink provides you with the ...
Kyla Ball
4 min read
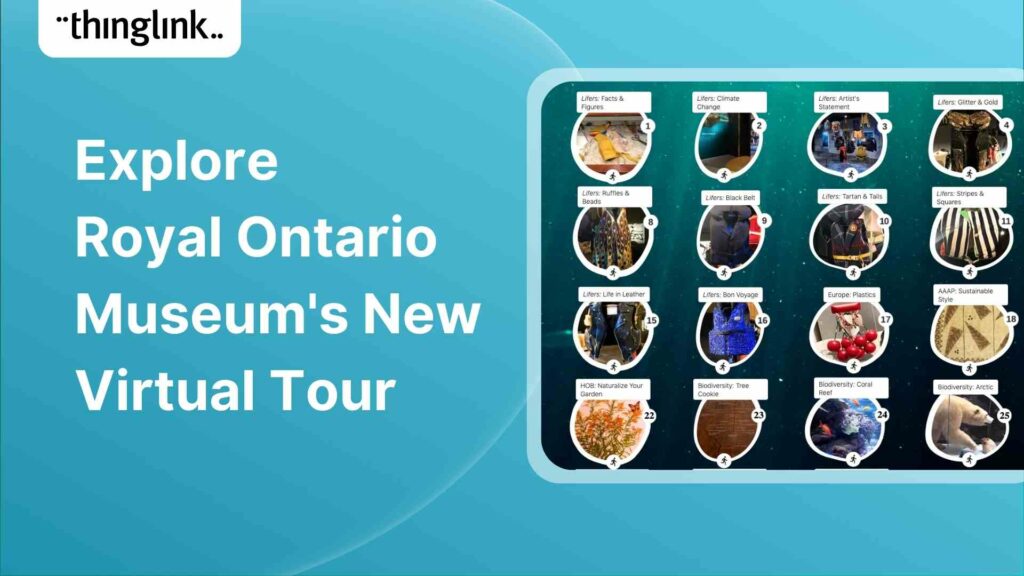
Behind the scenes at the museum Established in 1914 in Toronto, the Royal Ontario Museum (ROM) exhibits global art, culture, and natural history. It’s one...
Kyla Ball
4 min read
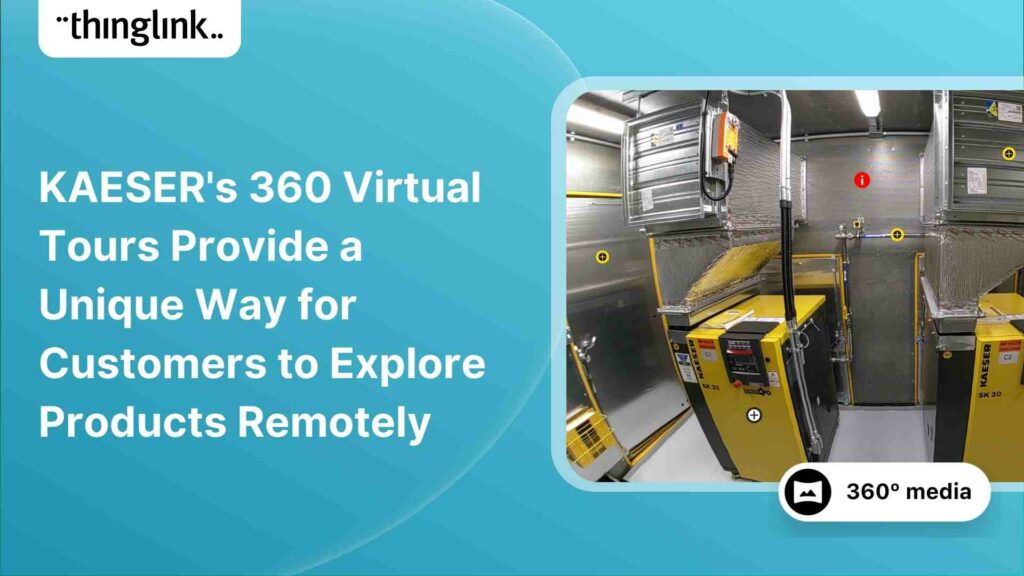
About KAESER KAESER Compressors is one of the world’s leading manufacturers and providers of compressed air products and services. They manufacture compressed ...
Kyla Ball
3 min read
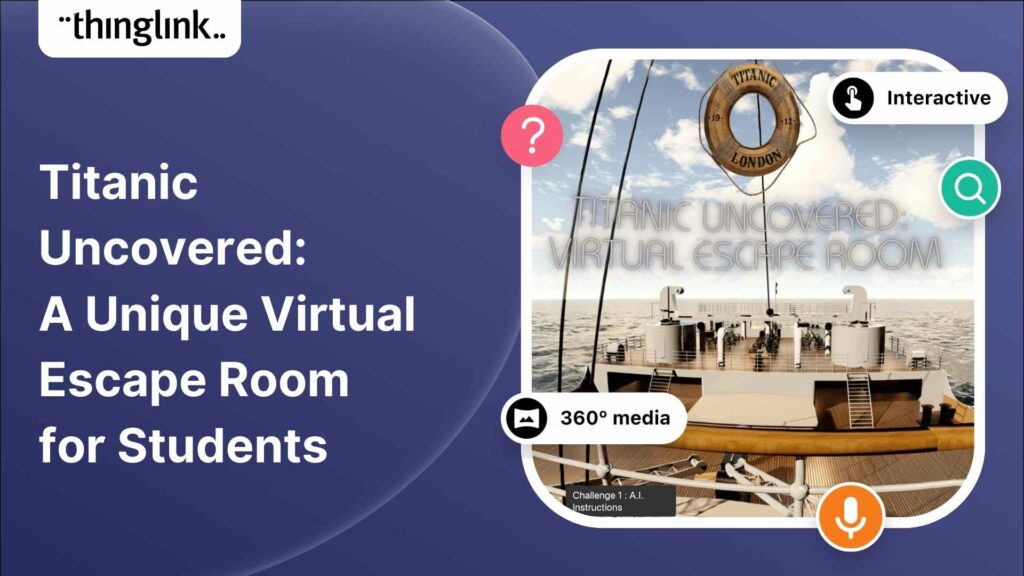
Educator Dwitney Bethel has created an incredible digital escape room using ThingLink’s Scenario Builder, set during the tragic maiden voyage of the Titanic...
Kyla Ball
8 min read
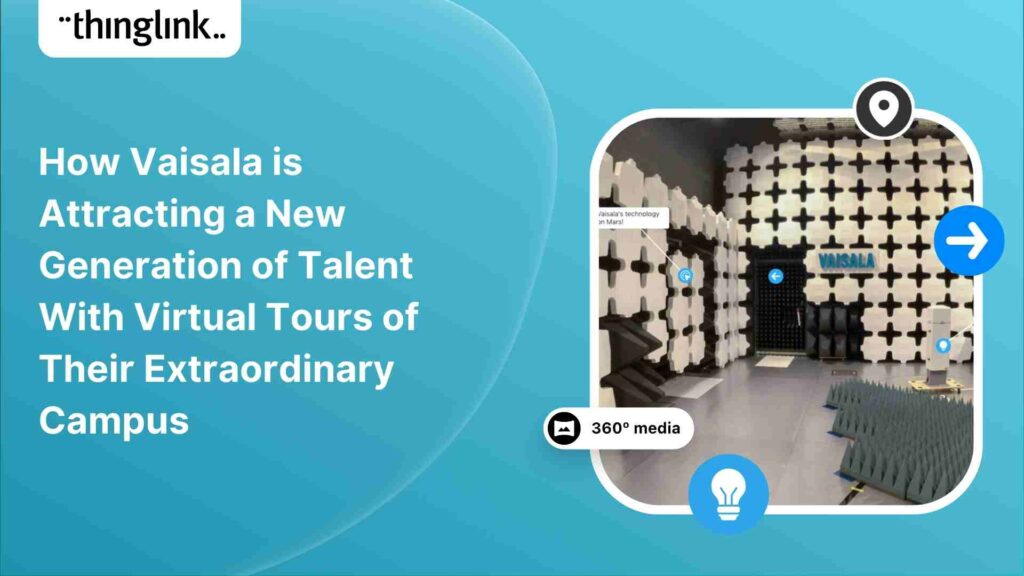
In this case study we look at how a global leader in weather and environmental measurements has opened up its incredible new R&D center and some of its other...
Kyla Ball
6 min read
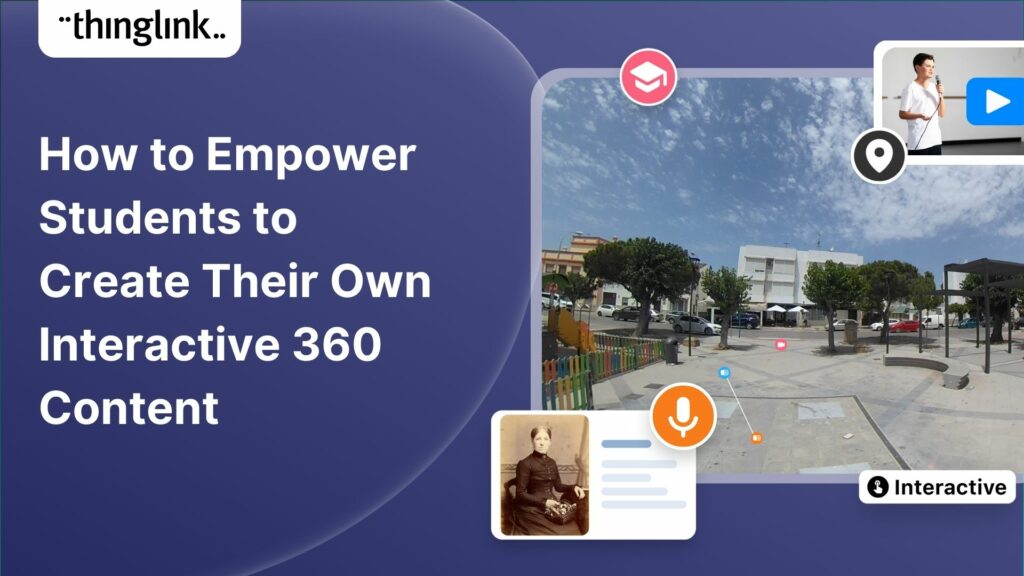
In addition to using interactive media and virtual reality to create your teaching materials, why not also give your students the tools and technology to become...
Kyla Ball
5 min read
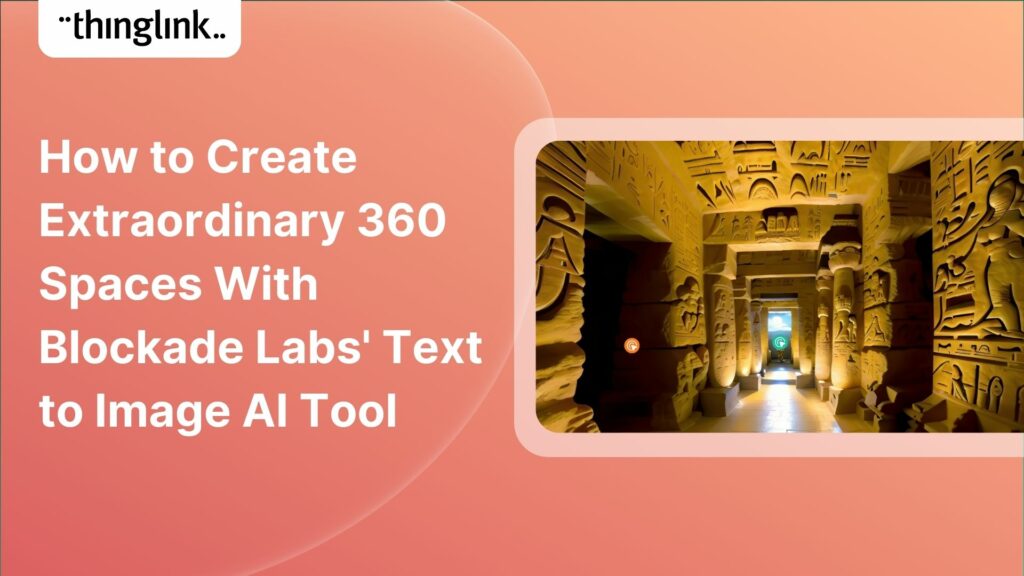
At ThingLink we are constantly striving to source and share with our creators the very best and most useful AI tools. To meet our criteria they must produce high...
Kyla Ball
6 min read
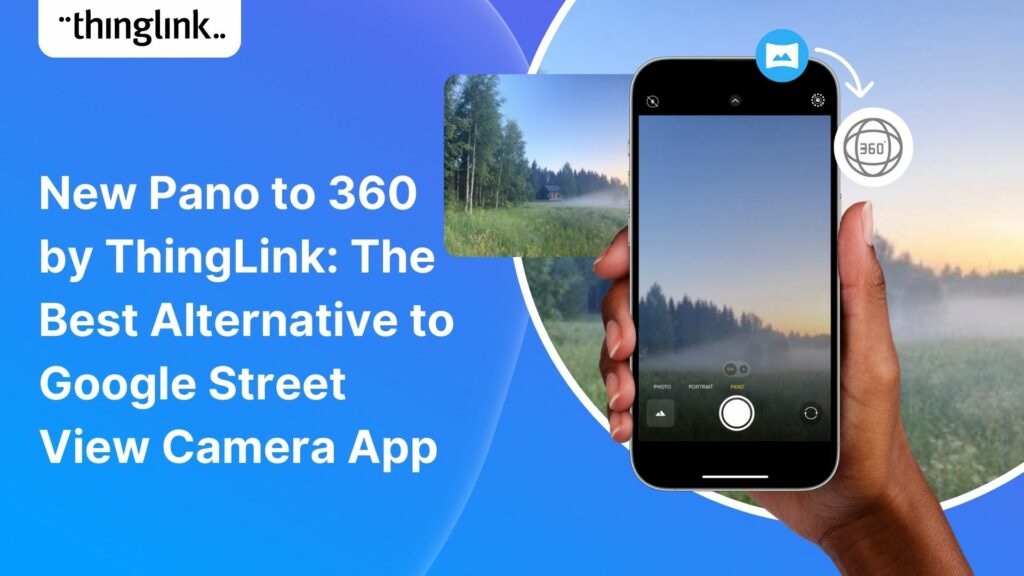
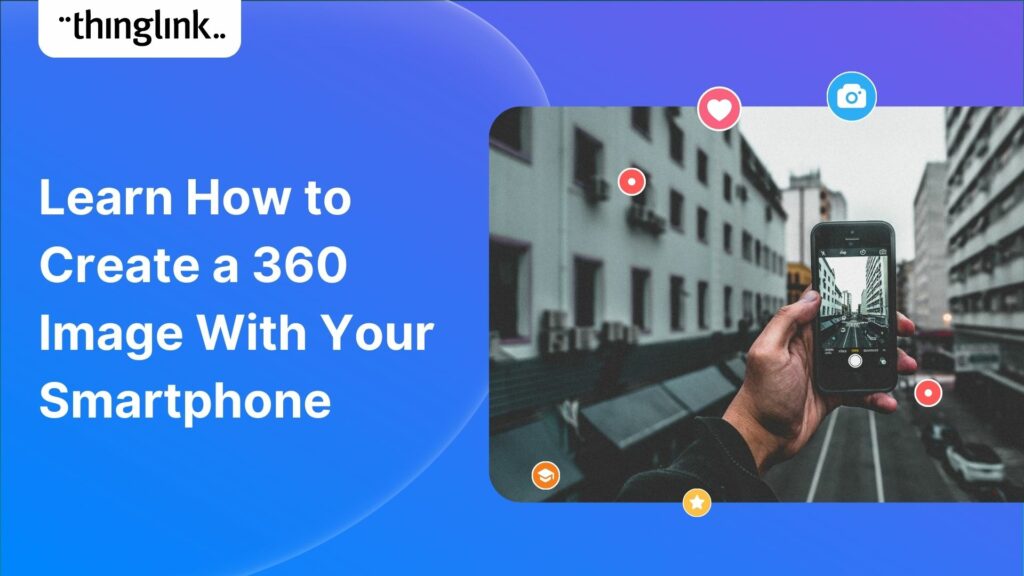
Dive into a universe of detail with Pano to 360: no more multiple shots, just easy, fully immersive 360 photospheres! Since Google decided to retire the beloved...
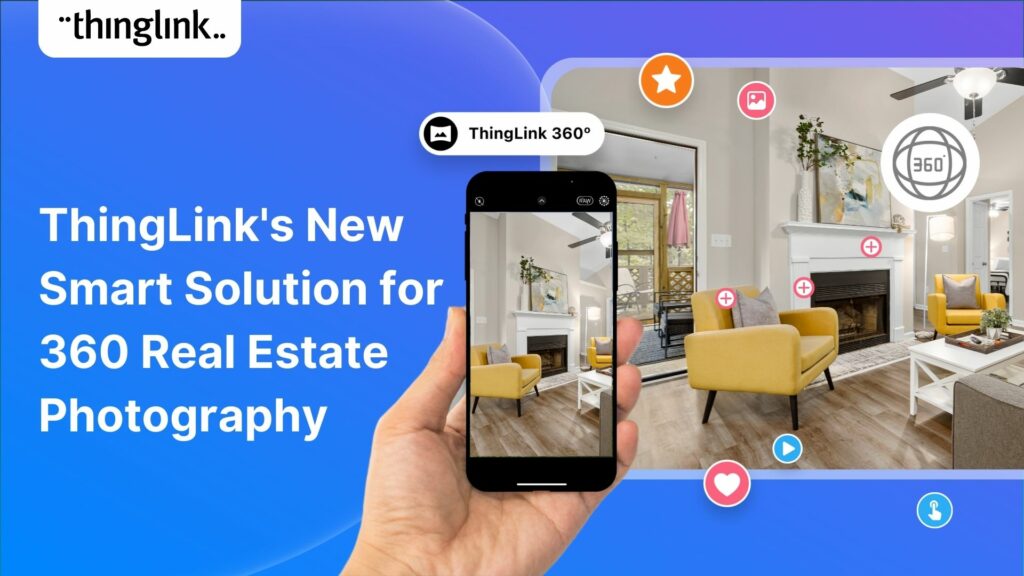
Virtual tours are now one of the cornerstones of real estate marketing, giving potential buyers the opportunity to view a property at a convenient time and place...
Kyla Ball
3 min read
ThingLink Launches a Revolutionary Solution for Capturing 360 Images In light of the discontinuation of the Google Street View Camera app, ThingLink has answered...
Kyla Ball
2 min read
QR codes are having a renaissance – and it’s well deserved! These versatile squares offer endless opportunities for creativity and engagement. In this...
Kyla Ball
6 min read
An effective marketing communications strategy is crucial for the success of any company, of any size. But for a small business or start up with no marketing team...
Kyla Ball
4 min read
Learners can create truly extraordinary content when they use and combine the latest AI tools for image generation. In this case study we demonstrate and celebrate...
Kyla Ball
7 min read
The Evolution of Storytelling in Museums It’s hard to imagine now, but there once was a time when traditional museum exhibits relied on static displays and...
Kyla Ball
5 min read
Virtual tours have become an integral part of the real estate industry, allowing potential buyers to explore properties from the comfort of their homes – ...
Kyla Ball
5 min read
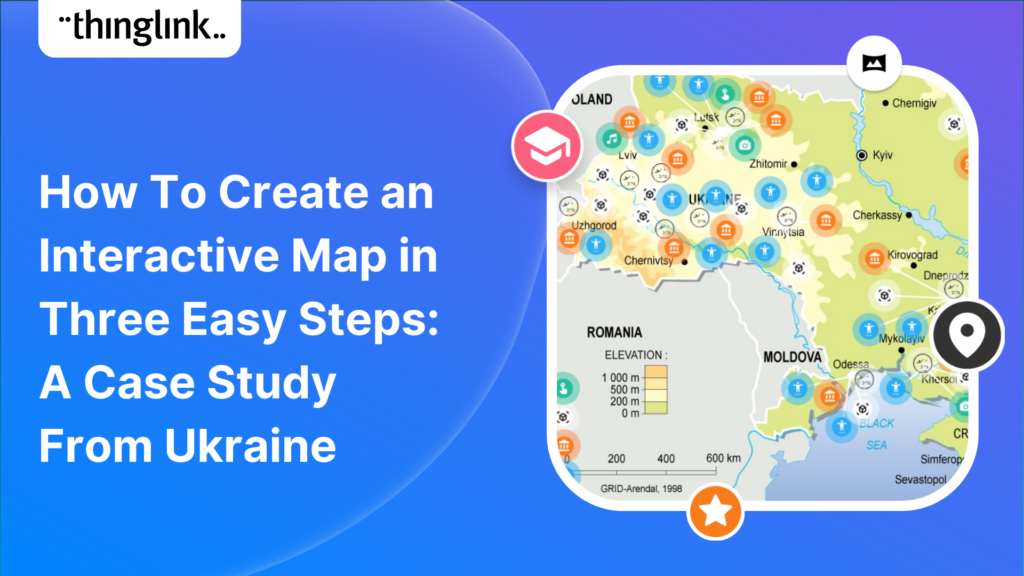
Educator Stephanie Woessner helped 17 schools in Ukraine to create an interactive ThingLink map together online. ThingLink spoke to her to hear how it was created,...
Kyla Ball
5 min read
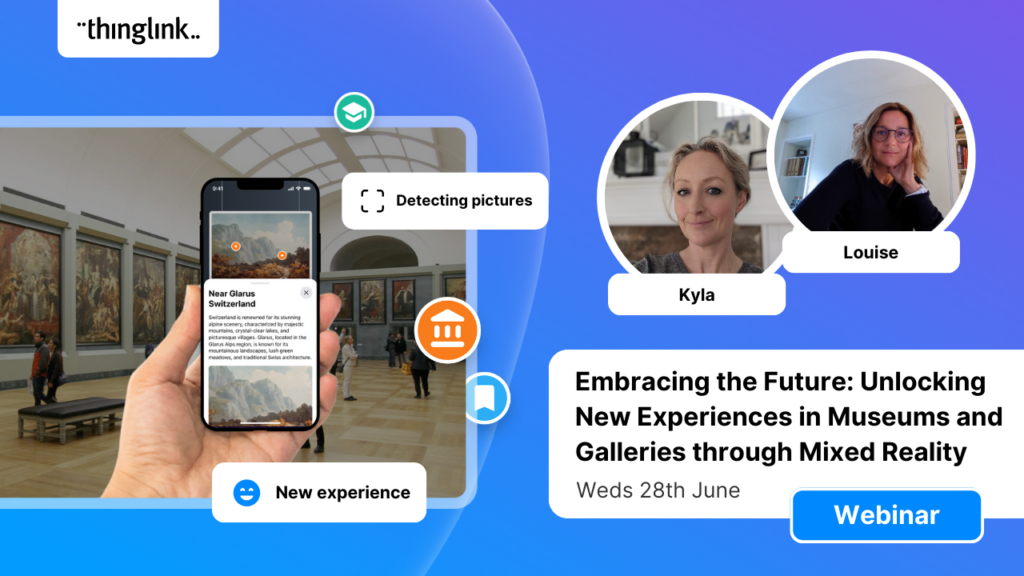
ThingLink has been a leader in learning technologies, consistently seeking innovative ways to stay ahead of the curve. As pioneers of mixed reality experiences ...
In this blog we look at what digital storytelling is, how it is being used, and provide three great examples of how ThingLink has been used for storytelling projects...
Kyla Ball
4 min read
In this blog we look at how you can use interactive videos – either as a training or educational tool for your learners, or for marketing or ecommerce purposes....
Kyla Ball
4 min read
Infographics are a great way to present complex information in a clear and concise way. They are used for data visualization across every sector and can package...
Kyla Ball
4 min read
In this blog we have put together a little toolbox of 7 creative thinking skills to help you boost creativity in your everyday life and work. It’s a common misconception...
Kyla Ball
4 min read
In this short blog we look at how storytelling has developed from its earliest forms to the ultra-short form content that we interact with, multiple times per day,...
Kyla Ball
5 min read
“Choose your own adventure meets tech and history” Stuhr Museum in Nebraska used ThingLink’s Scenario Builder to create an emotive and immersive branched ...
Kyla Ball
8 min read
In recent months, GPT3 has moved out of the tech news sections and into the headlines. But what is it exactly? How does it work and why has it become such a hot...
Kyla Ball
5 min read
Why is content marketing important? Content marketing is a powerful tool for businesses to reach and engage their target audience. It’s the cornerstone of...
Kyla Ball
4 min read
What is content marketing? Content marketing is a strategic approach to creating and distributing valuable content that is designed to build relationships with ...
Kyla Ball
3 min read
We are delighted to share this inspirational case study from RM, true education technology pioneers who work with thousands of schools and educational institutions...
Kyla Ball
2 min read
What is content marketing? Content marketing is a powerful strategy that businesses of all sizes can use to build an engaged audience and generate more leads. It...
Kyla Ball
4 min read
Content marketing has become an integral part of any successful business strategy, regardless of business type or size. It helps to create relationships, build ...
Kyla Ball
4 min read
Our final post of 2022, from the University of Southampton is a fitting example to round off the year. The Centre for Higher Education Practice’s Advent Calendar...
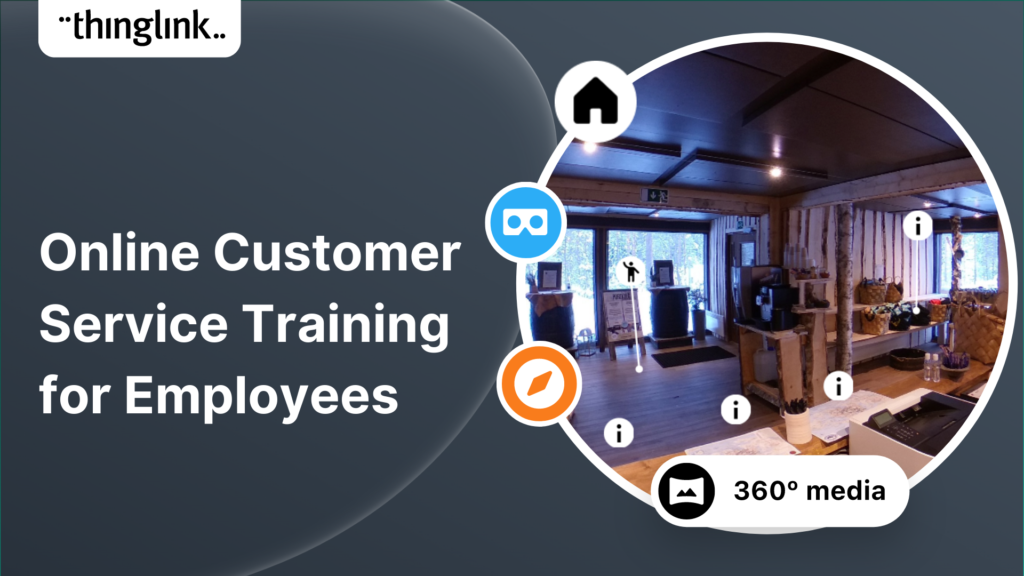
What is online training for employees? As many businesses have learnt in a post-pandemic digital age, online training or elearning for employees is becoming...
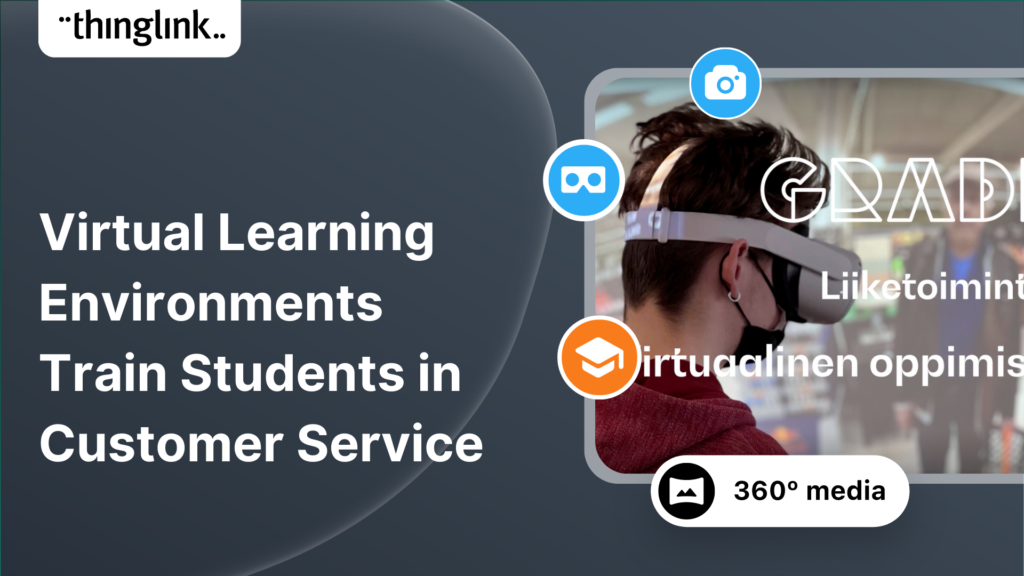
Gradia Vocational School has created new learning course content for the business education sector, using 360 video simulation technology in ThingLink. The elearning...
 Matias
3 min read
Matias
3 min read
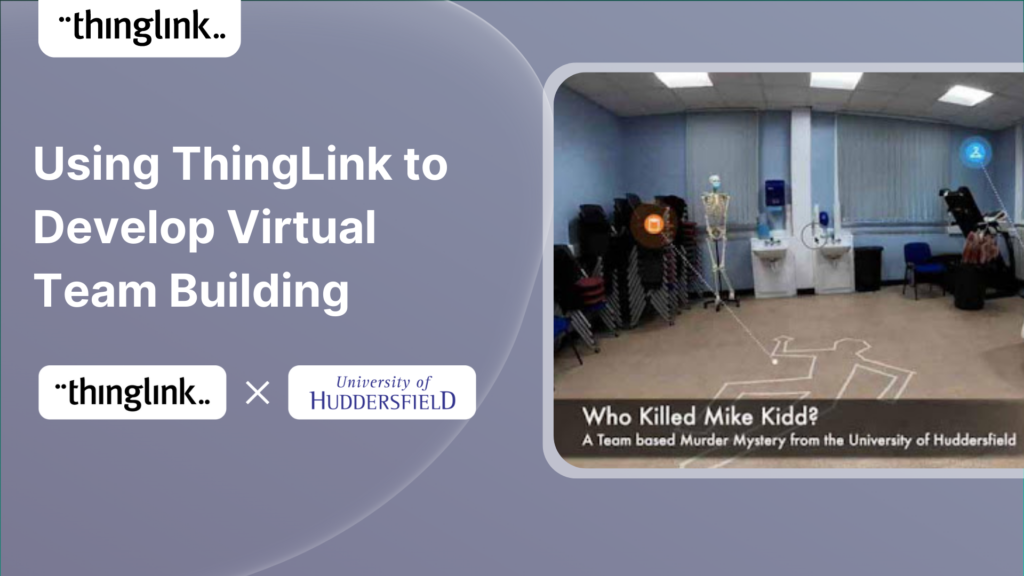
This case study was written by Tim Cappelli, Lead for Technology Enhanced Learning and Hayley Hewitt, Instructional Designer, both from the University of Huddersfield....
Kyla Ball
11 min read
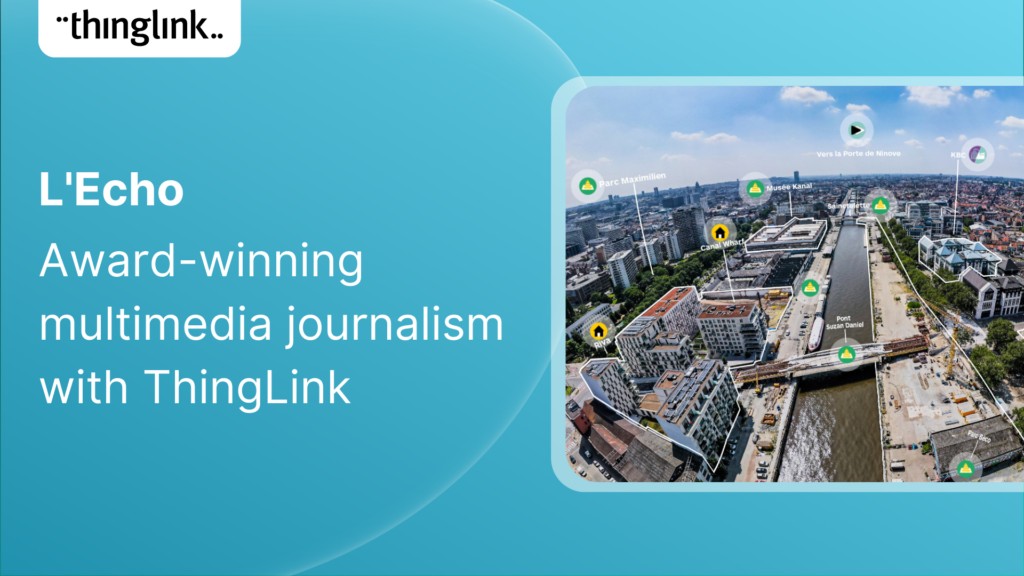
Multimedia reporting is being used ever more frequently by all media platforms. In this blog we showcase a great example of multimedia journalism from Belgium which...
Kyla Ball
5 min read
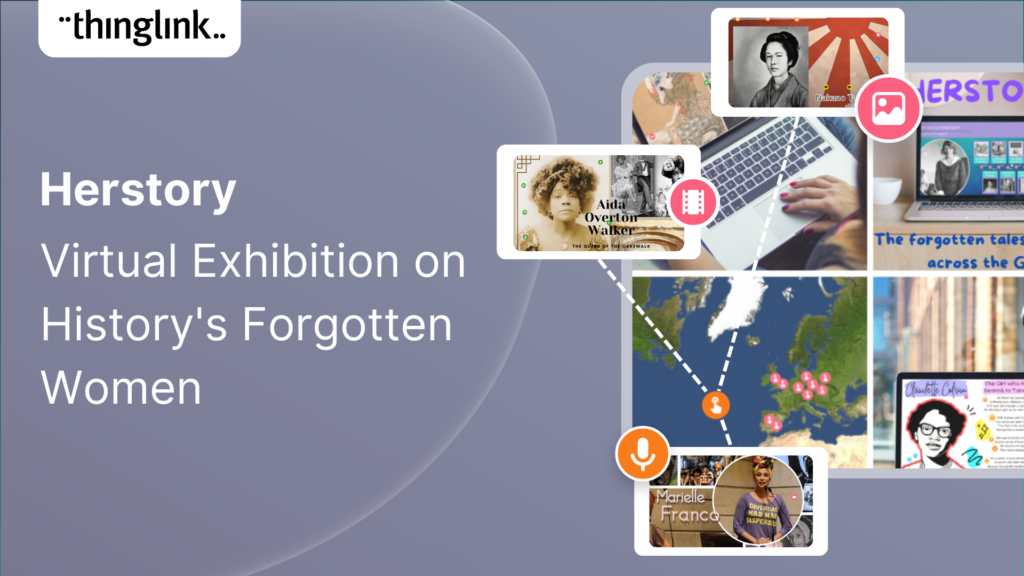
In this blog we look at how students from UCLan created a virtual exhibition about history’s forgotten women, the process they used to create it and the results...
Kyla Ball
4 min read
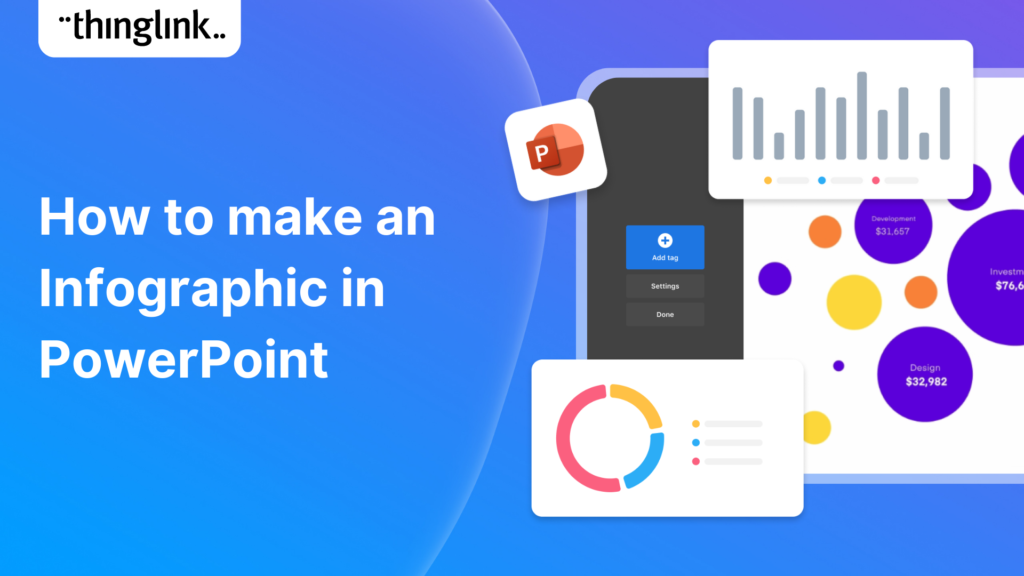
In this blog post, we’ll show you how to make an infographic in Microsoft PowerPoint. Working with shapes, images, icons, and text you can easily create a...
If you create or provide eLearning courses or workplace training, or you create any type of content marketing, you need to know how to use infographics. Infographics...
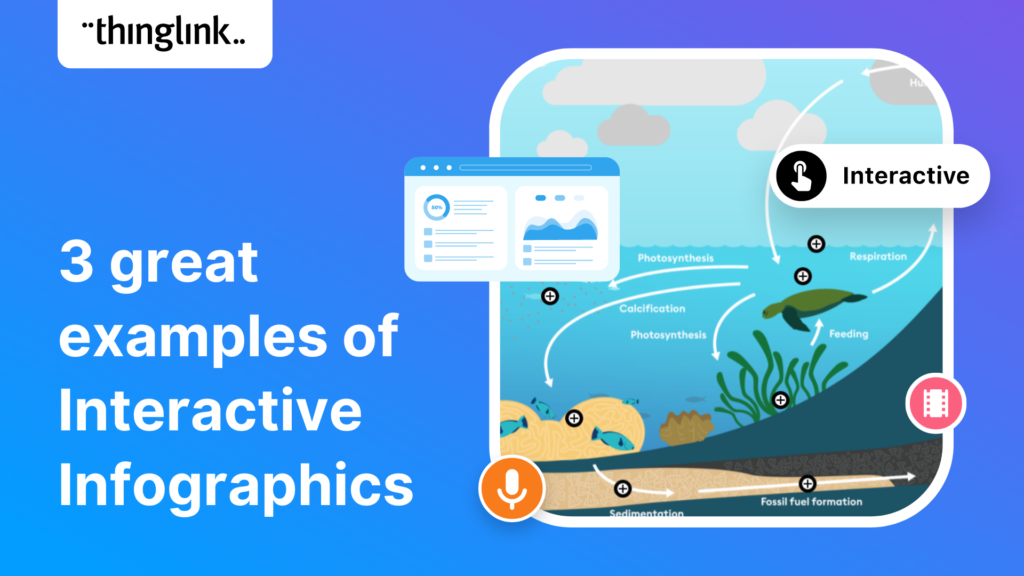
Infographics are the fastest and easiest way to present any complex information. In this blog we’ll show you how to create interactive infographic designs even...
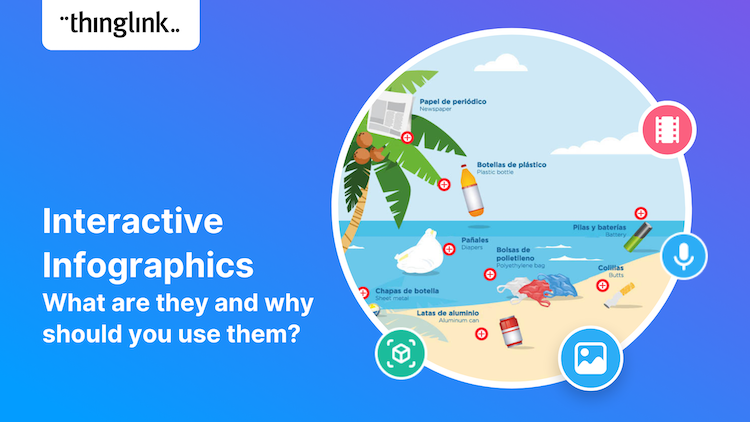
How can you make engaging interactive infographics if you’re not a professional graphic designer? In fact, creating this type of visual content can be really ...
Increase the effectiveness of your online training with multimedia interactive simulations and virtual tours. eLearning course content creation is easy with ThingLink!...
Your viewers won’t get lost with this brilliant new virtual tour feature! Our latest ThingLink update enables you to add a floor plan or ‘mini map’ that shows...
Some inspiring examples of interactive maps created by ThingLink users. Thanks to mobile apps like Google maps, we are now all used to using maps every day that...
Kyla Ball
4 min read
“There are those who follow maps, and those who make them.” Alberto Villoldo How to create interactive maps You don’t need to invest in an expensive...
Kyla Ball
2 min read
5 types of interactive content you can easily create today with ThingLink September 14, 2022 / 4 minutes of reading / By Louise Jones Stuck ...
Kyla Ball
5 min read
What is interactive content? The opposite of static or passive content, interactive content is one which users actively participate in or engage with. This...
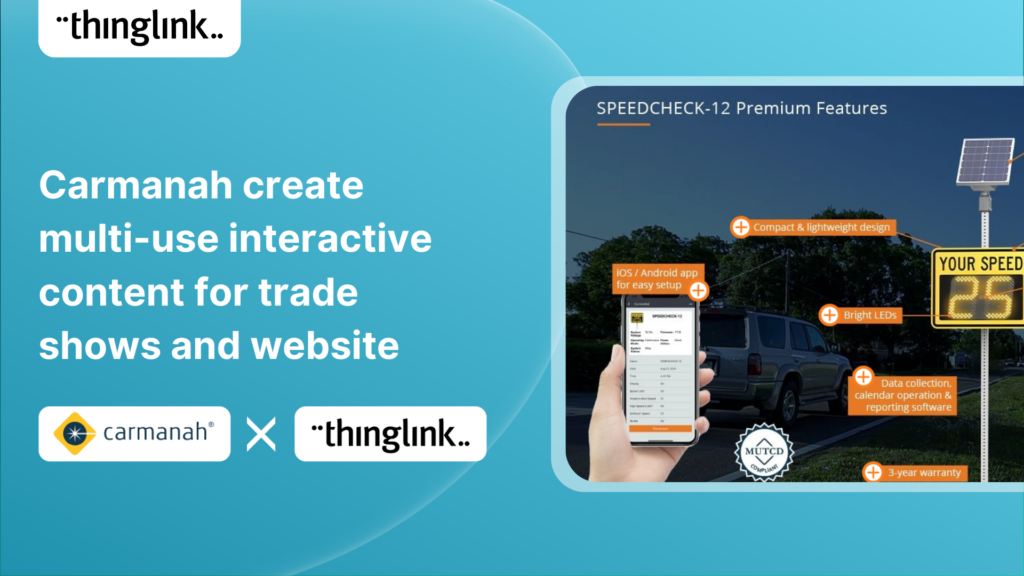
Background Carmanah is a company based in British Columbia, Canada, that helps improve road safety with a range of products including flashing beacons, radar speed...
Kyla Ball
5 min read
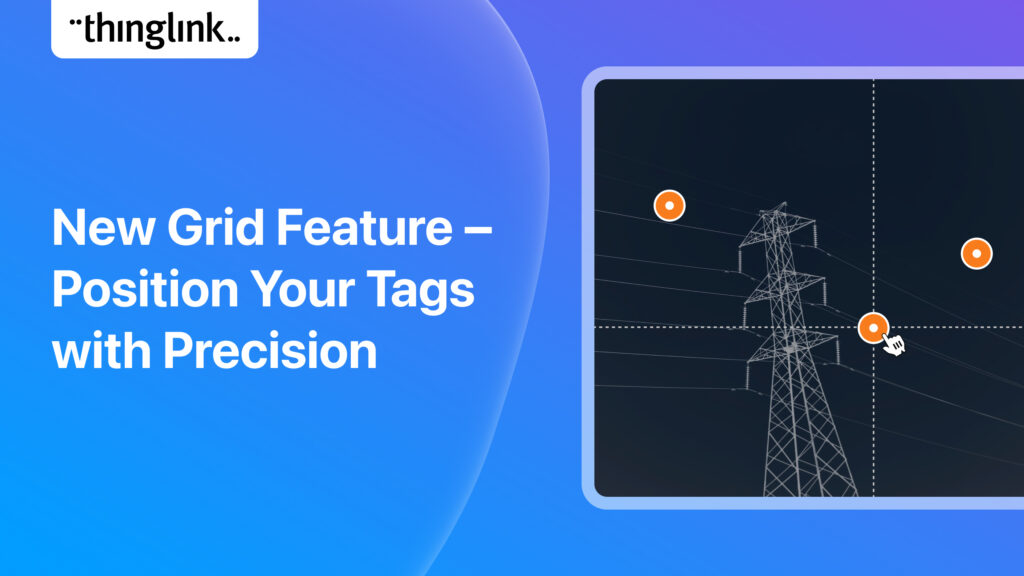
It’s now even easier to create slick and professional-looking interactive content with another of ThingLink’s handy new content tools. The Grid Feature allows...
ThingLink has been placed in an impressive three separate categories by Capterra, the free online service that helps organizations choose the right software. In...
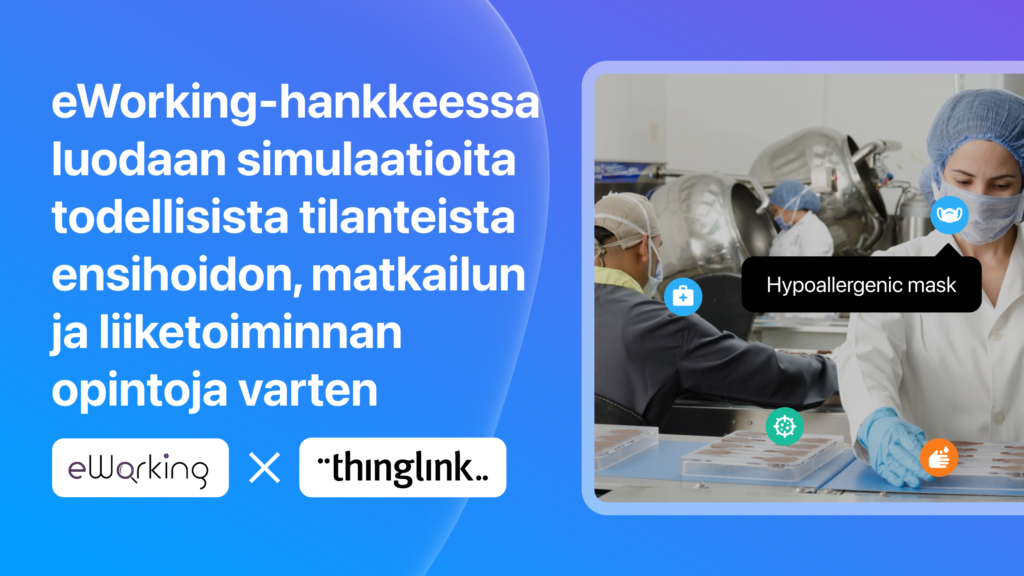
Ammattiopisto Samiedun eWorking-hankkeessa opettajat ja työnantajat luovat yhdessä koulutusmateriaalia, josta hyötyvät sekä opiskelijat että uudet työntekijät....
Matias
7 min read
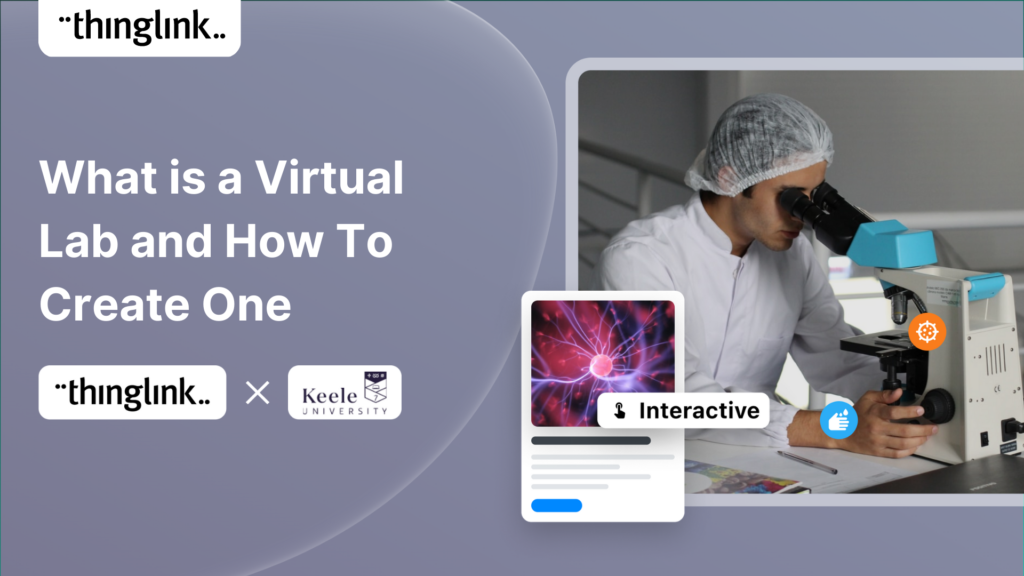
ThingLink Virtual Labs help address accessibility and inclusivity challenges for science students Many ThingLink creators in the Higher Education sector have carried...
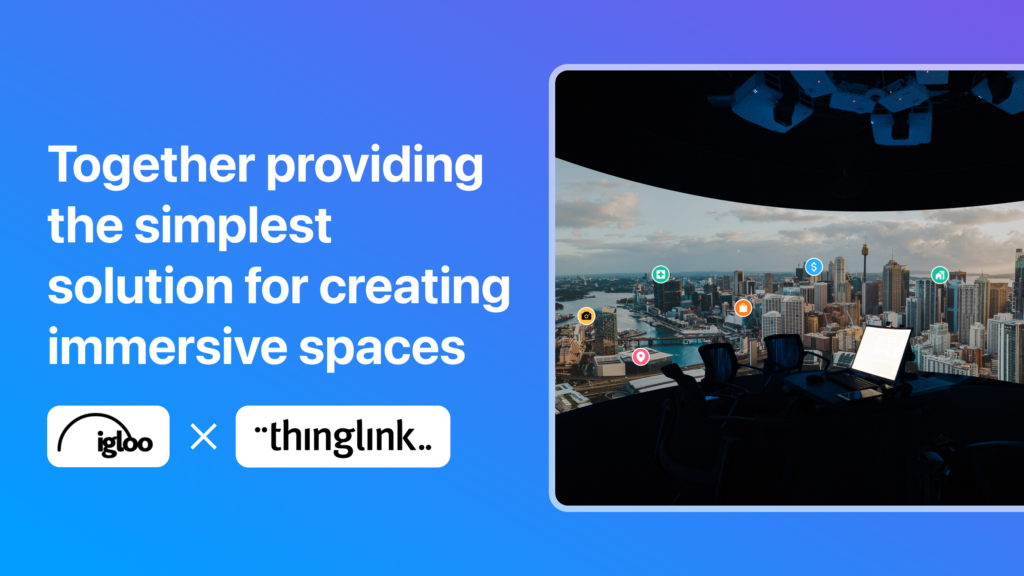
With over 20 years of visionary experience between them, ThingLink and Igloo Vision have crafted a reality for the future of immersive spaces. ThingLink is the ...
Calgary University Library creates beautifully simple virtual tours and orientation guides to assist new students with library resources We are always excited to...
Kyla Ball
5 min read
In Finland, eight vocational educational institutions collaborated to create a diverse online learning environment – the HyGGe school – where users ...
Matias
7 min read
HyGGe-hankkeessa hyvinvointiteknologia halutaan tuoda tutuksi hyvinvointialan opiskelijoille ja ammattilaisille tarinoiden avulla. Aidontuntuiset caset auttavat...
Matias
7 min read
Miten sähköisissä oppimateriaaleissa voitaisiin hyödyntää teknologian mukanaan tuomia parhaita puolia? Miten voidaan esimerkiksi varmistaa, että opettaja...
Matias
5 min read
The Royal Ontario Museum ROM (the Royal Ontario Museum) was founded in Toronto in 1914, and showcases art, culture and nature from around the world. One of the ...
Kyla Ball
7 min read
Virtual museum exhibition puts historic artefacts in context for the first time. The Highland Folk Museum in Scotland have created 5 virtual museum sites in ThingLink,...
Kyla Ball
7 min read
How could transferrable skills, or “transversal competence” mentioned in the Finnish general upper secondary curriculum be taught in an inspiring way?...
Norelcolla uusien sähköasentajien koulutuksiin halutaan panostaa, jotta työntekijät oppisivat työvaiheet kerralla oikein tuottavimmalla menetelmällä. Isommassa...
Matias
5 min read
Miten lukion uuden opetussuunnitelman laaja-alaista osaamista voisi opettaa innostavasti? Miten opettaa esimerkiksi demokratiakasvatusta ja yhteiskunnallista osaamista?...
Matias
6 min read
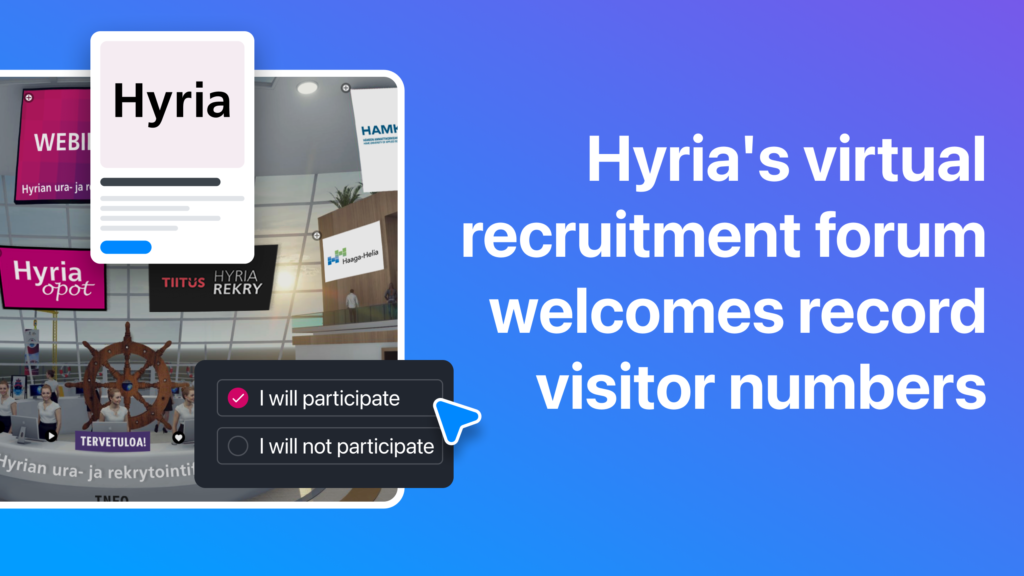
Are you looking for a way for your students to find out about job opportunities, learn about education options and get feedback on their CVs? When they couldn’t...
Kyla Ball
7 min read
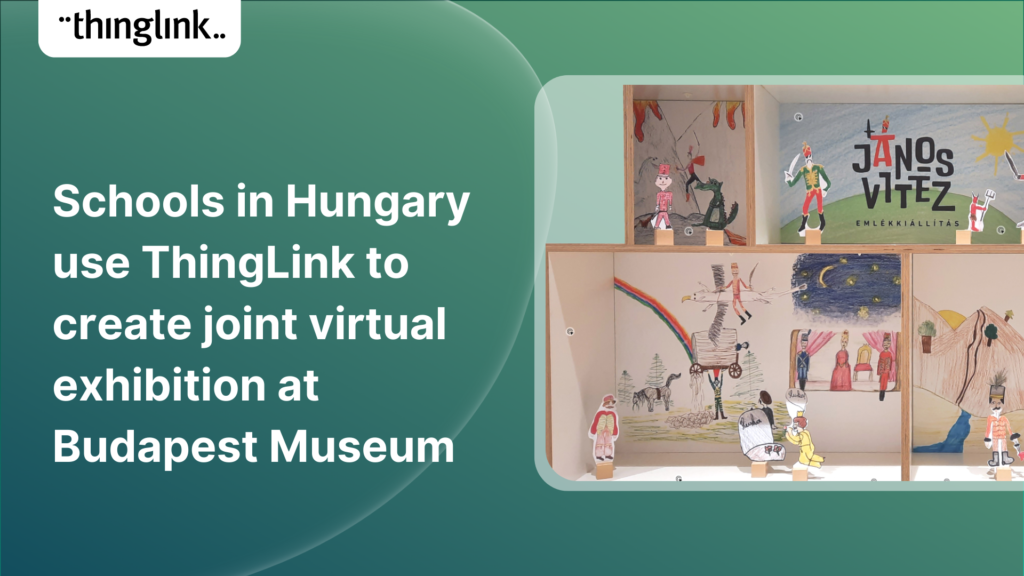
The János Vitéz Memorial Exhibition is a collaborative virtual exhibition organized by the Petofi Literary Museum in Budapest. Between March and May 2021, over...
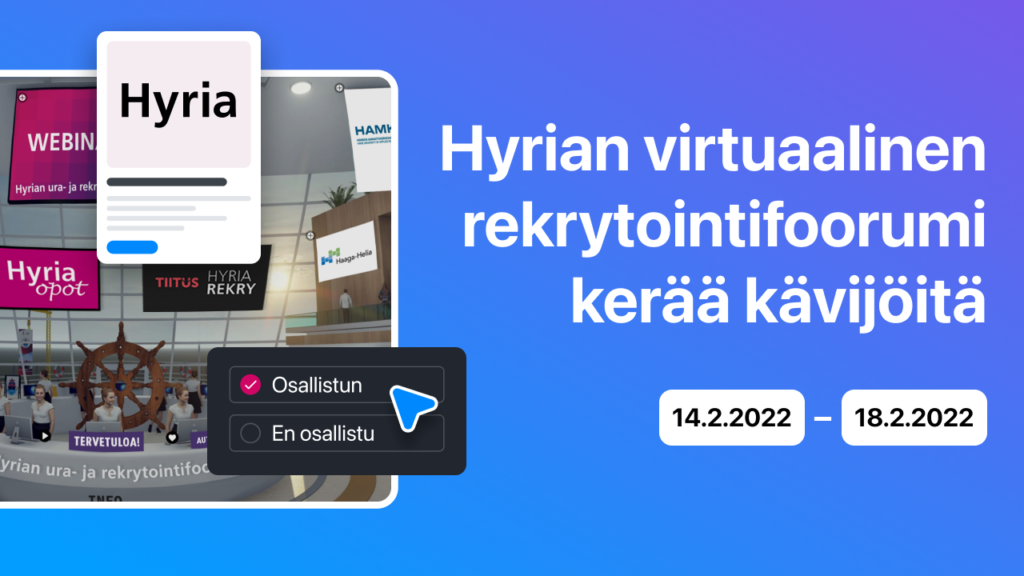
Kuinka opiskelijat pääsisivät kuulemaan työpaikoista, selvittämään opiskeluvaihtoehtoja ja saamaan palautetta CV:nsä tekoon pandemia-aikana? Rekrytointitapahtumaa...
Matias
8 min read
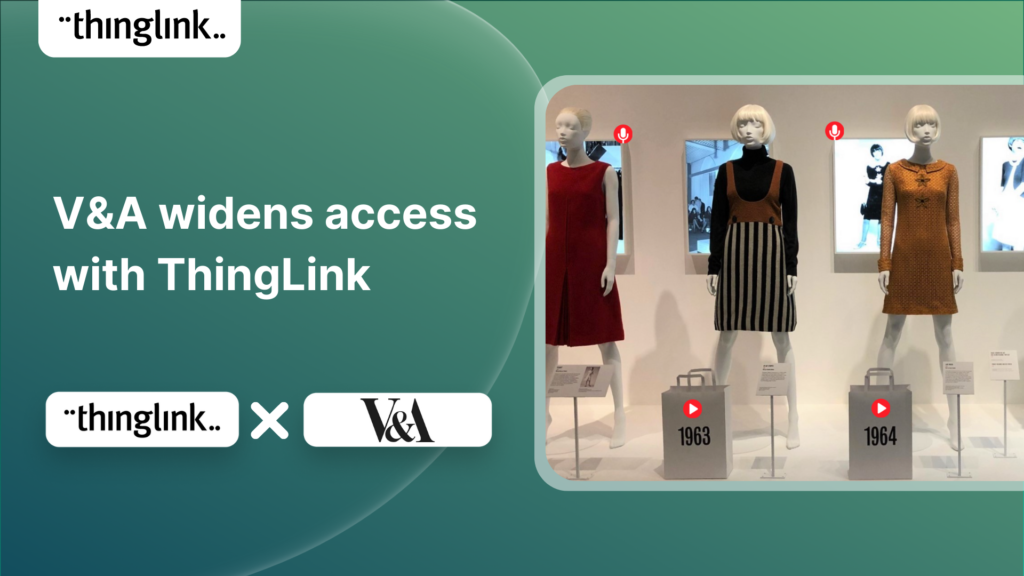
The Scottish design museum creates interactive learning resources that reflect the innovative, global and democratising themes in their recent exhibitions. This...
CEBS, a global provider of IT solutions for digital transformation, announces partnership with immersive learning platform ThingLink to accelerate the adoption...
Matias
2 min read
ThingLink + Fingrid create virtual electricity power station environments for immersive, effective site safety training Are you looking for a cost-effective, carbon-efficient...
Miten turvallisuusopastuksissa voitaisiin säästää aikaa ja ajokilometrejä? Miten kontakteja voitaisiin vähentää pandemia-aikana? Fingridillä uusien työntekijöiden...
Matias
5 min read
In this case study we take a look at how a lecturer created an award-winning series of interactive virtual tours of field trip sites for post graduate students ...
Kyla Ball
6 min read
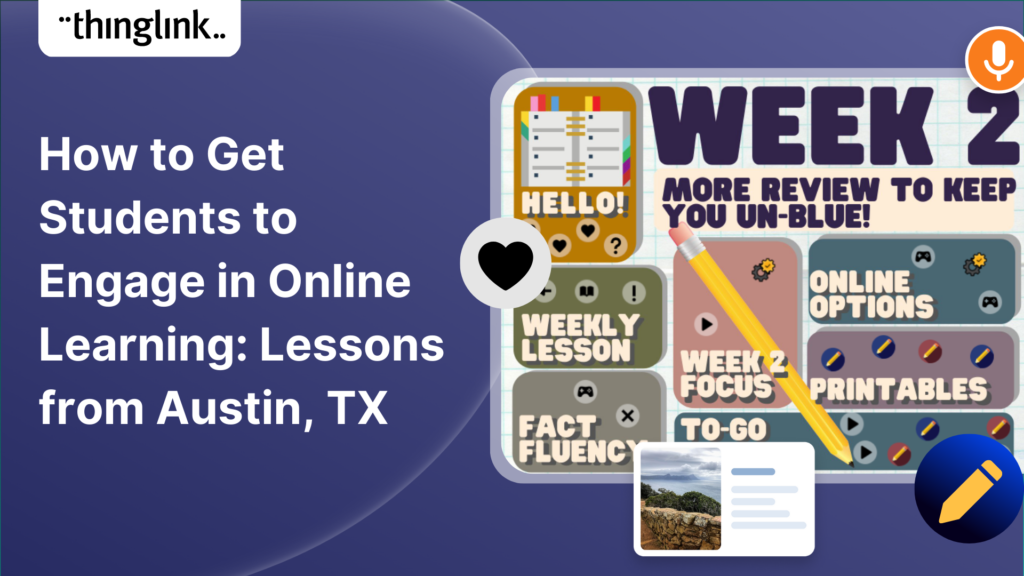
New Caney Independent School District (ISD) added ThingLink to their roster of online learning resources in 2020 and it soon became a valuable tool with many applications....
Kyla Ball
5 min read
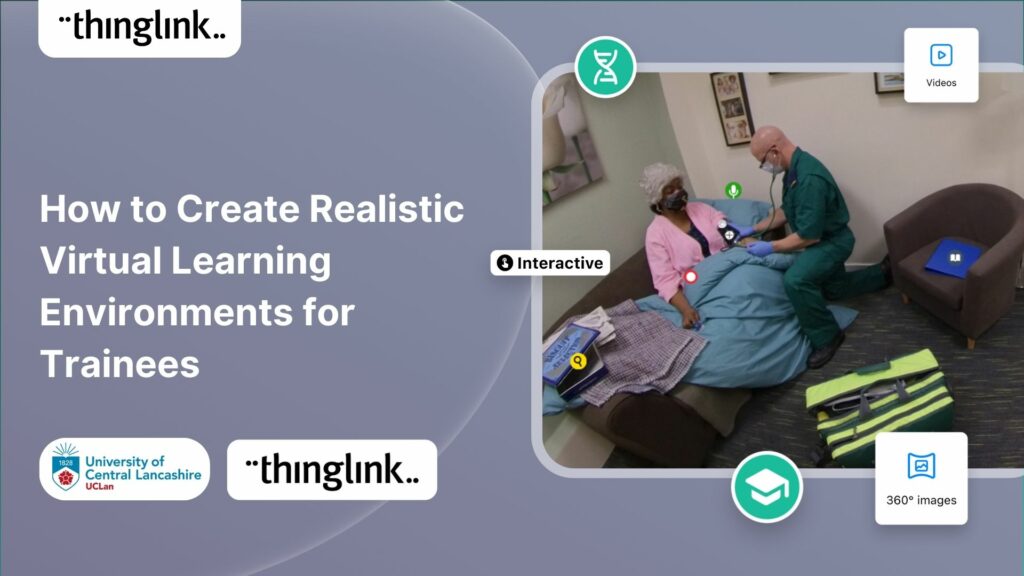
The medical school at the University of Central Lancashire uses real-life escape rooms to recreate typical time-critical emergencies for students. They used ThingLink...
Kyla Ball
6 min read
Using ThingLink for your business or organisation? Great news: our team has curated a collection of top 10 examples of ready-to-use Canva design templates that ...
Kyla Ball
4 min read
Luxury holiday accommodation brand Hidden Highland Retreats used ThingLink to create 360 tours to improve their website and service experience as well as train ...
Kyla Ball
5 min read
A youth-adult fellowship used online graphic design platform Canva when creating a highly impactful ThingLink to showcase video testimonials. This memorable and...
Kyla Ball
5 min read
Some university courses can move online easily, but how do you engage your online students in hands-on subjects involving machinery, materials and complex construction,...
Kyla Ball
5 min read
Newspapers across the globe are moving increasingly online and in many cases behind pay walls. But with so much free content to compete with, how do regional titles...
Kyla Ball
6 min read
An historic institution looks to the future Florida A&M University in Tallahassee FL was founded in 1887, and is the highest-ranked of the public HBCUs (Historically...
Kyla Ball
4 min read
The Helsinki Region Environmental Services Authority (HSY) have an admirable vision to create the world’s most sustainable urban region. In 2020 they co-organized...
Kyla Ball
5 min read
In this case study we look at how the University of Southampton used ThingLink to create virtual tours of field sites for their learners to better prepare them ...
Kyla Ball
6 min read
Are you looking to create Virtual Tours and Expeditions? Do you need to view tours in Virtual Reality mode? ThingLink is the perfect solution for the task. This...
During the pandemic the University of Rochester realised that their popular in-person tours couldn’t take place – which was a serious blow to student recruitment....
Kyla Ball
4 min read
When Covid cancelled a medical school’s in-person workshop, ThingLink provided a way that learners could work with an interactive and realistic scenario to piece...
Kyla Ball
5 min read
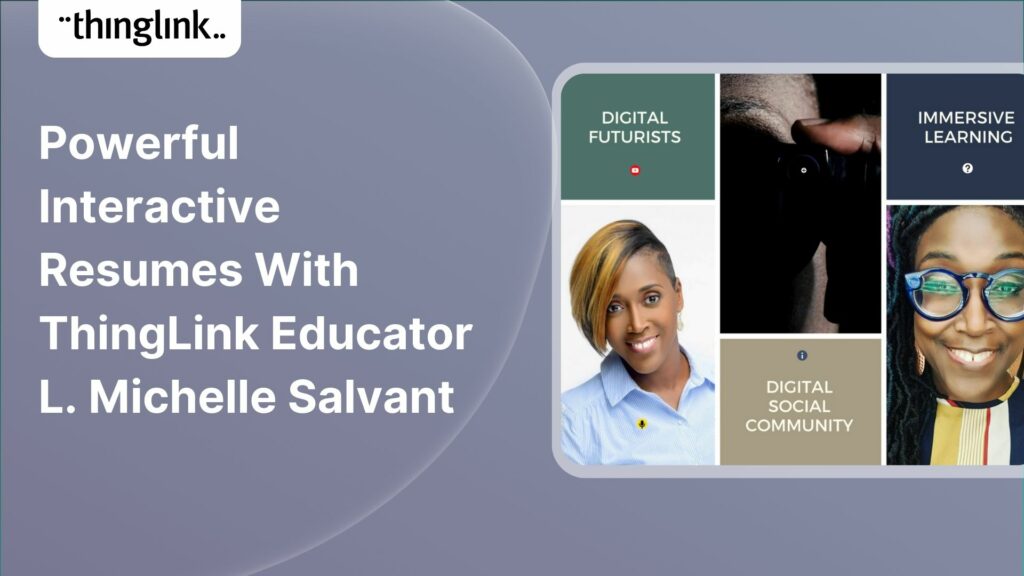
One of the ways ThingLink is increasingly being used by colleges, universities and schools is helping young people visualize their interests and skills using a ...
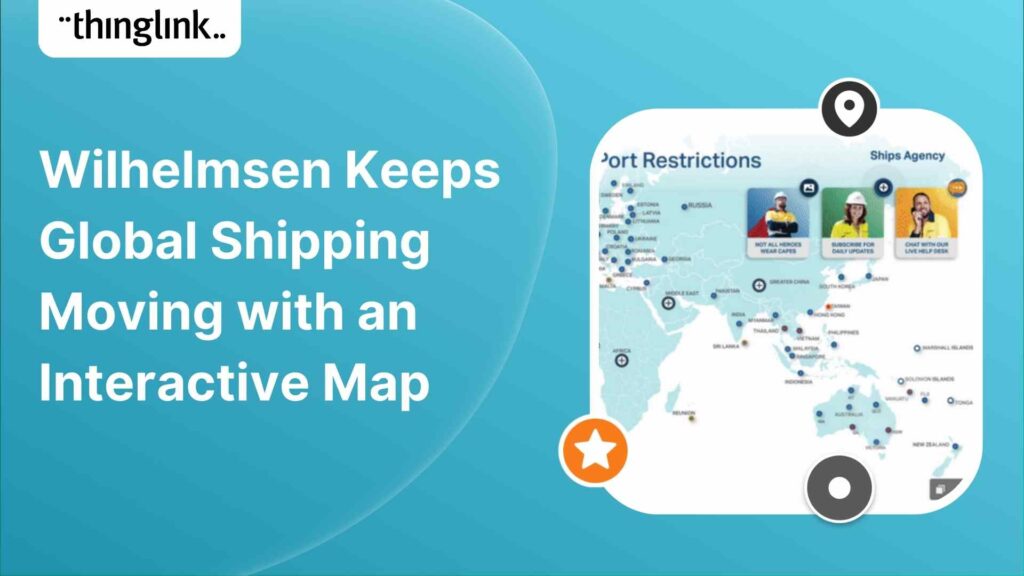
Wilhelmsen is a global maritime industry group, employing more than 21,000 people across 75 nations. The Wilhelmsen group operates the largest maritime network ...
Our education and learning community continues to impress us with new and original concepts and iterations on interactive online learning environments. From the...
We recently shared with you a blog post detailing ways colleges and universities are creating virtual campus tours and field trips. We wished to dive into this ...
Kyla Ball
3 min read
Wherever high school students plan to study, most would ideally like to do an on-campus visit to the schools that they are considering. But the covid pandemic made...
Curators at Middlebury College Museum of Art in Vermont, Sarah Laursen and Sarah Briggs, developed Vermont Art Online with ThingLink when museums and galleries ...
Virtual tours are most commonly associated with 360/VR images, videos or still images of a physical space. FashionUnited shows how ThingLink expands this notion...
Stewart’s Melville College is part of ESMS, a unique family of Independent Schools in Edinburgh, Scotland and has been providing education to boys for over 150...
Making maps and aerial views actionable with interactive hotspots is one of the top use cases amongst all ThingLink user segments. Maps are especially conducive...
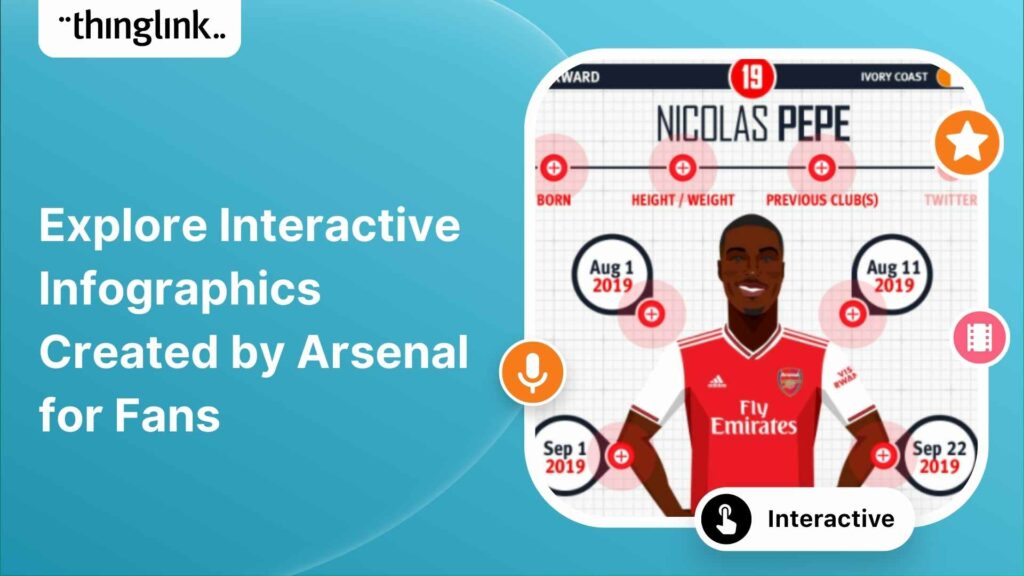
English football club Arsenal used cleverly designed interactive illustrations to create an immersive experience for their fans to meet each player. While navigating...
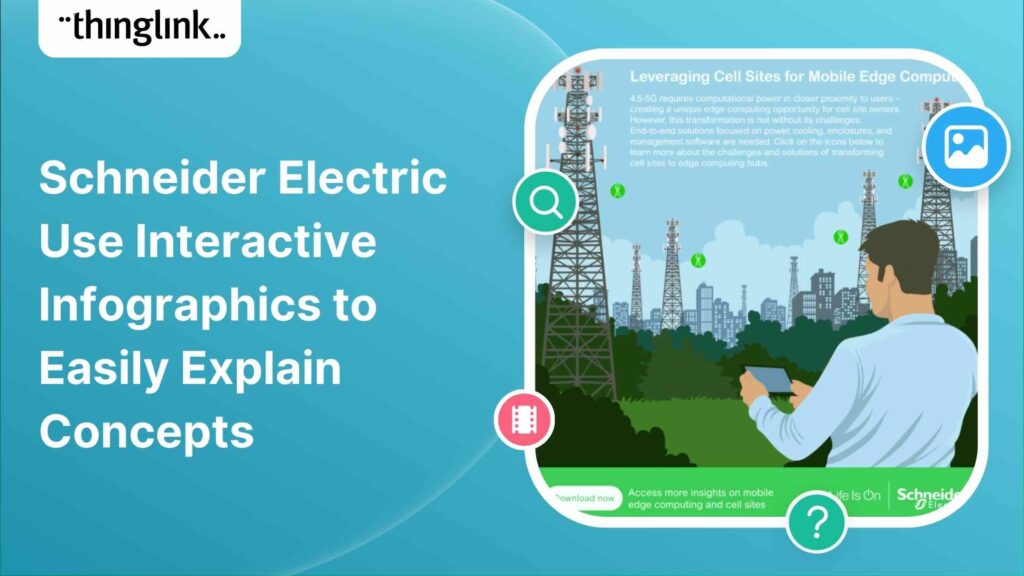
Schneider Electric SE is a French multinational company that specializes in digital automation and energy management. They are long-time ThingLink users who...
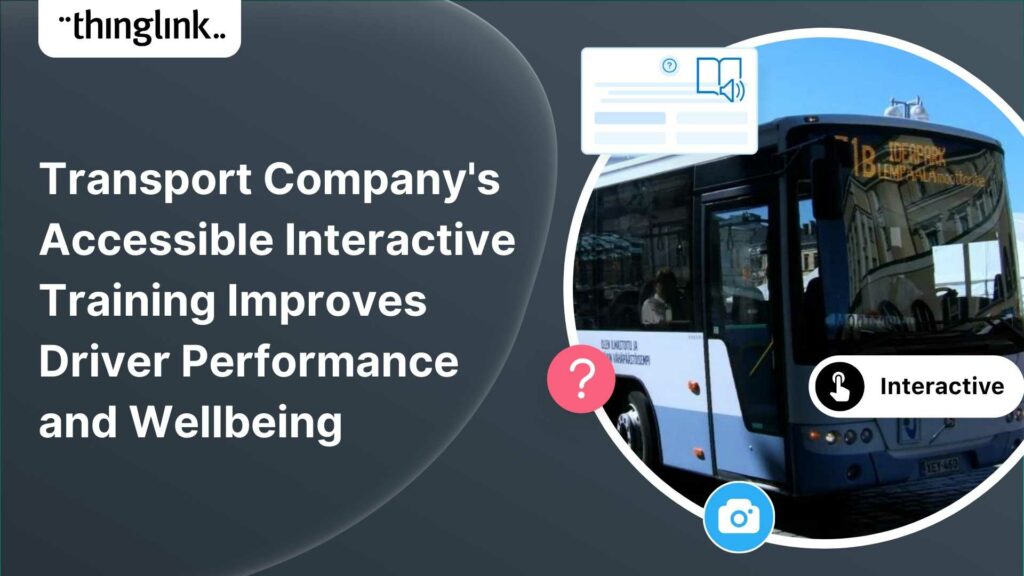
Väinö Paunu is a transportation company from Tampere, Finland. The company was looking for new ideas and tools for training their bus drivers. This need came ...
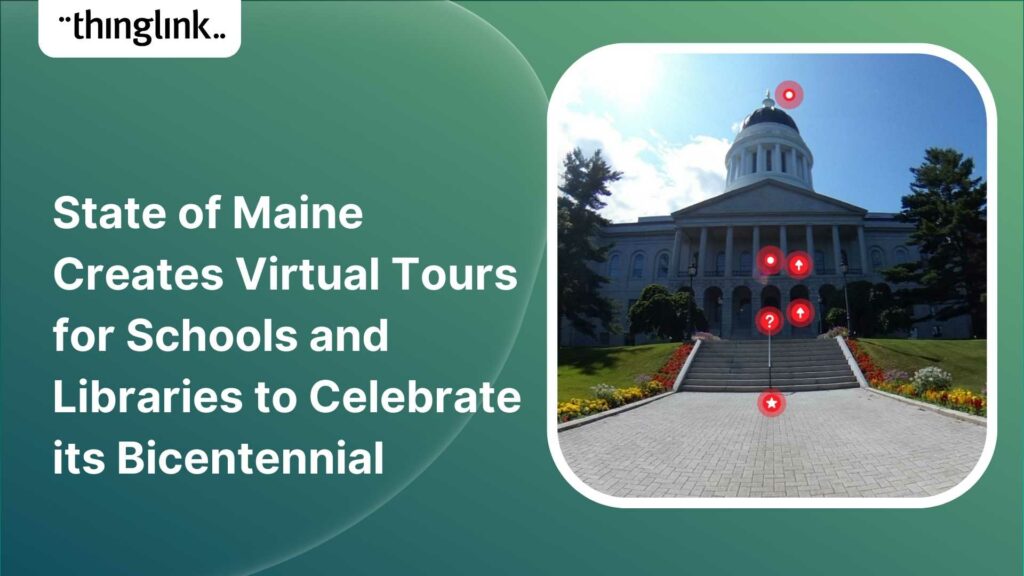
Kristen Muszynski is the director of communications at the Department of the Secretary of State in Maine. Some time ago her colleague Tammy Marks, director of the...